
Figures & data
Figure 1. The mean concentration-time curves in rat plasma after oral administration of losartan or both GLT and losartan. (A) losartan; (B) EXP3174.
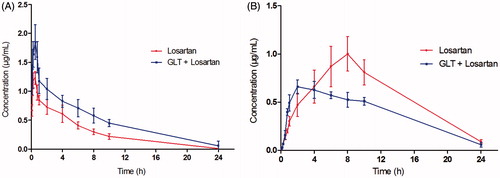
Table 1. Pharmacokinetic parameters of losartan and EXP3174 in male Sprague–Dawley rats following oral administration of losartan alone (Group A) or both losartan and GLT (Group B).