Figures & data
Table 1. Primers for real-time PCR.
Figure 1. Cell viability and proliferation of human glioblastoma cells. (A) U87 (left) and U251 (right) cells were treated with 6.25, 12.5, 25, 50, 100 and 200 μmol/L of berberine for 48 h before cell viability was determined by MTT assay. (B) U87 (left) and U251 (right) cells were treated with 25, 50 and 100 μmol/L of berberine for 48 h before cell proliferation was determined by EdU assay. ***p< 0.001 vs. control. All experiments were repeated at least three times.
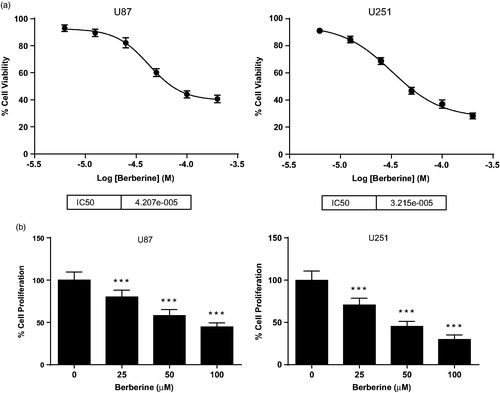
Figure 2. Cell migration and tube formation of HUVEC. (A) HUVEC was seeded into Transwell and treated with 50 μmol/L of berberine for 12 h. (B) HUVEC was seeded into Matrigel and treated with 50 μmol/L of berberine for 6 h. ***p< 0.001 vs. control. All experiments were repeated at least three times.
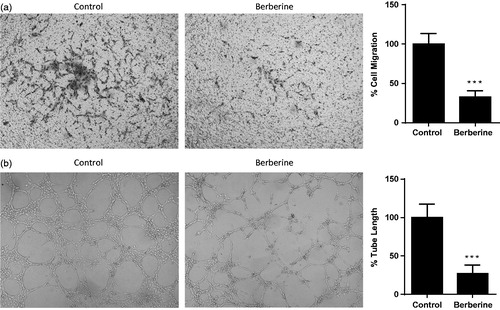
Figure 3. Tumour growth in ectopic xenograft model of glioblastoma. Athymic nude mice were injected subcutaneously with U87 cells (1 × 10⁶ cells in 0.1 mL PBS), and treated with vehicle (carboxymethylcellulose sodium) or 50 mg/kg of berberine by oral gavage for 28 days. (A) Tumour volume. (B) Tumour weight. ***p< 0.001 vs. vehicle group. *p< 0.05 vs. vehicle group. N = 6 for each group.
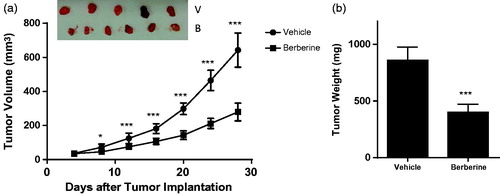
Figure 4. Tumour growth in orthotopic xenograft model of glioblastoma. Athymic nude mice were injected intracranially with U87 cells (2 × 10⁵ cells in 5 μL of methylcellulose) by stereotactic surgery, and treated with vehicle (carboxymethylcellulose sodium) or 50 mg/kg of berberine by oral gavage for 28 days. Survival studies were assessed using the Kaplan–Meier survival curves and analysed with the Mantel–Cox log-rank test. N = 8 for each group.
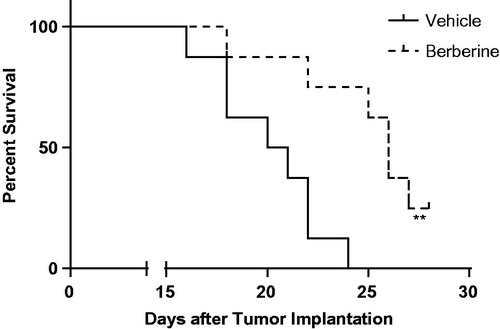
Figure 5. Angiogenesis analysis in tumour tissue from ectopic xenograft model. (A) Haemoglobin content determined by colorimetric method. (B) mRNA expression of CD31 determined by real-time PCR. ***p< 0.001 vs. vehicle group. N = 6 for each group.
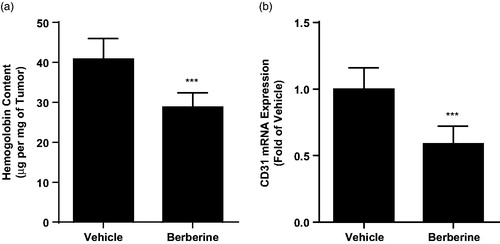
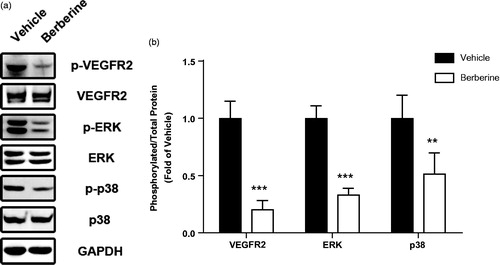
Figure 6. Molecular mechanisms involved in antiangiogenic effect of berberine. Tumour tissue from ectopic xenograft model was isolated and homogenized for Western blot analysis. ***p< 0.001 vs. vehicle group, **p< 0.01 vs. vehicle group. N = 6 for each group.