Figures & data
Figure 1. The chemical structure of lysionotin.
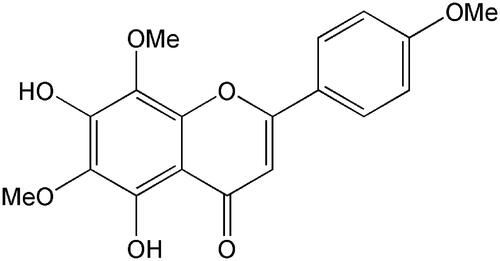
Table 1. Isoforms tested, marker reactions, incubation conditions, and Km used in the inhibition study.
Table 2. HPLC analysis conditions for mentioned CYP isoforms.
Figure 2. Effects of lysionotin on the activity of CYPs, including CYP1A2, 3A4, 2A6, 2E1, 2D6, 2C9, 2C19, and 2C8. *p < 0.05. Negative control: incubation without lysionotin or specific inhibitors. Lysionotin: incubation with 100 μM lysionotin. Positive control: incubation with specific inhibitors.
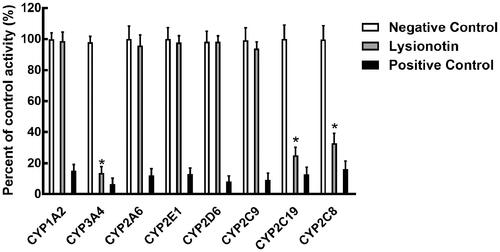
Figure 3. The dose-inhibition curves of lysionotin on CYP3A4 (A), 2C19 (B), and 2C8 (C).
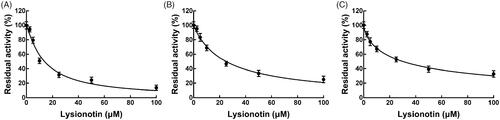
Figure 4. Lineweaver-Burk plots (A) and the secondary plot for Ki (B) of inhibition of lysionotin on CYP3A4 catalysed reactions (testosterone 6β-hydroxylation) in pooled HLM. Data were obtained from a 30 min incubation with testosterone (20–100 μM) in the absence or presence of lysionotin (0–30 μM). All data represent the mean of the incubations (performed in triplicate).
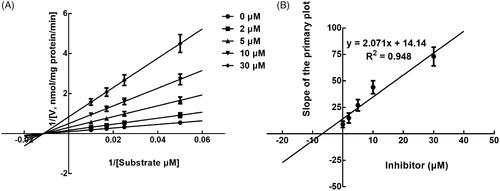
Figure 5. Lineweaver-Burk plots (A) and the secondary plot for Ki (B) of inhibition of lysionotin on CYP2C19 catalysed reactions (S-mephenytoin 4-hydroxylation) in pooled HLM. Data were obtained from a 30 min incubation with mephenytoin (50–200 μM) in the absence or presence of lysionotin (0–50 μM). All data represent the mean of the incubations (performed in triplicate).
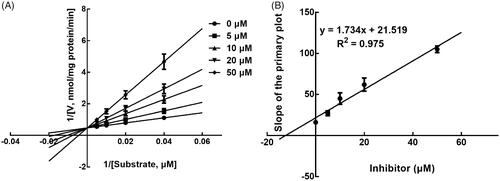
Figure 6. Lineweaver-Burk plots (A) and the secondary plot for Ki (B) of inhibition of lysionotin on CYP2C8 catalysed reactions (paclitaxel 6α-hydroxylation) in pooled HLM. Data were obtained from a 30 min incubation with paclitaxel (5–20 μM) in the absence or presence of lysionotin (0–50 μM). All data represent the mean of the incubations (performed in triplicate).
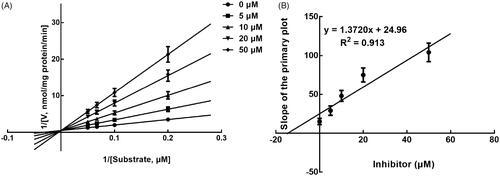
Figure 7. Effect of incubation time on the inhibition of CYP3A4, 2C19, and 2C8.
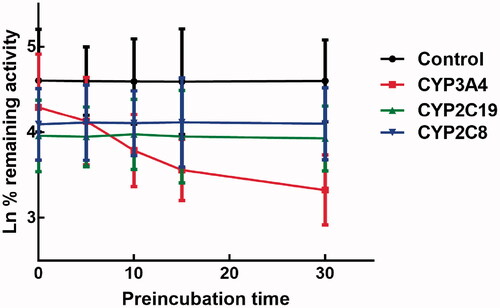
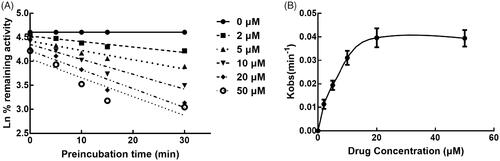
Figure 8. Time and concentration-inactivation of microsomal CYP3A4 activity by lysionotin in the presence of NADPH. The initial rate constant of inactivation of CYP3A4 by each concentration (Kobs) was determined through linear regression analysis of the natural logarithm of the percentage of remaining activity versus pre-incubation time (A). The KI and Kinact values were determined through non-linear analysis of the Kobs versus the pachymic acid concentration (B).