Figures & data
Table 1. Antibodies used in this study.
Figure 1. Circulatory levels of alanine aminotransferase (ALT), aspartate aminotransferase (AST) and γ-glutamyl transferase (γ-GT). Serum levels of ALT (A), AST (B) and γ-GT (C) in the experimental groups of rats were determined using an automatic-analyser. Values are expressed as mean ± standard deviation (SD; eight rats/group). avs. control group. bvs. kaempferol-treated control group. cvs. APAP (acetaminophen)-treated rats.

Figure 2. Levels of tumour necrosis factor-α (TNF-α) (A) and interleukin 6 (IL-6) (B) in the liver homogenates of the experimental groups. Values are expressed as mean ± SD (eight rats/group). avs. control group. bvs. kaempferol-treated control group. cvs. APAP (acetaminophen)-treated rats.
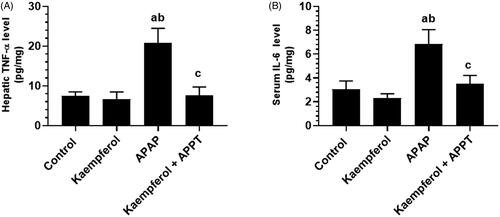
Figure 3. Levels of malondialdehyde (MDA) (A), reactive oxygen species (ROS) (B), glutathione (GSH) (C) and superoxide dismutase (SOD) (D) in the liver homogenates of the experimental groups. Values are expressed as mean ± SD (eight rats/group). avs. control group. bvs. kaempferol-treated control group. cvs. APAP (acetaminophen)-treated rats.
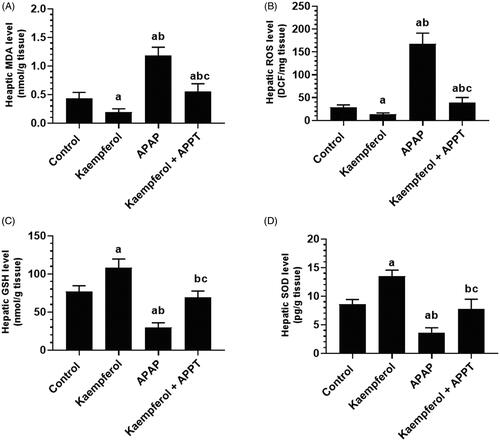
Figure 4. Light micrographs of liver tissues from all groups after H&E staining. (A, B) control and kaempferol-treated rats, respectively, showing normal hepatocytes (H) and blood sinusoids (S) around the central veins (CVs). (C) APAP-treated rats showing swollen hepatocytes and wide blood sinusoids around the CVs. Some apoptotic and necrotic hepatocytes (H1), and inflammatory cells (arrows) were also seen. Some accumulation of erythrocytes was observed inside the CVs. (D) Kaempferol + APAP-treated rats showing normal hepatocytes and blood sinusoids around the CVs. Very few inflammatory cells (arrows) were seen around the CVs.
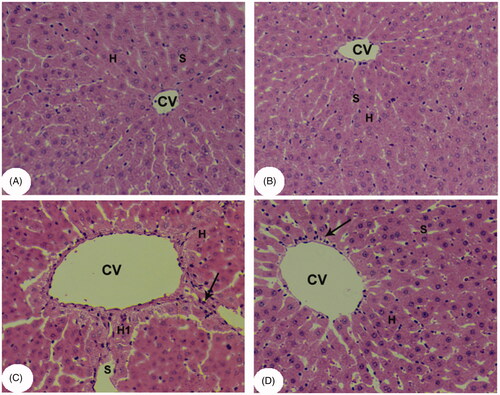
Figure 5. Protein levels of Bcl-2 (A), Bax (B), cleaved caspase-3 (C) and manganese superoxide dismutase (MnSOD) (D) in the liver homogenates of all experimental groups. Values are expressed as mean ± SD (six rats/group). avs. control group. bvs. kaempferol-treated control group. cvs. APAP (acetaminophen)-treated rats.
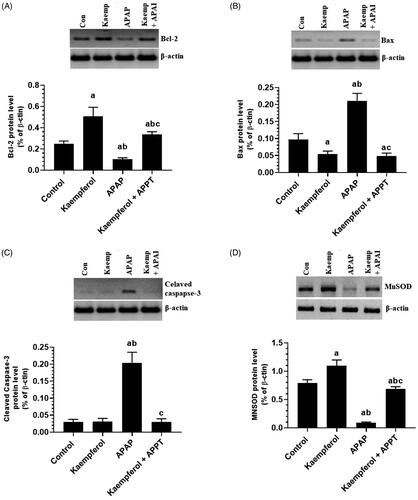
Figure 6. Nuclear activity of SIRT1 (A), protein levels of SIRT1 (B), cytochrome-2E1 (CYP2E1) (C) and PARP1 (D) in the liver homogenates of all experimental groups. Values are expressed as mean ± SD (six rats/group). avs. control group. bvs. kaempferol-treated control group. cvs. APAP (acetaminophen)-treated rats.
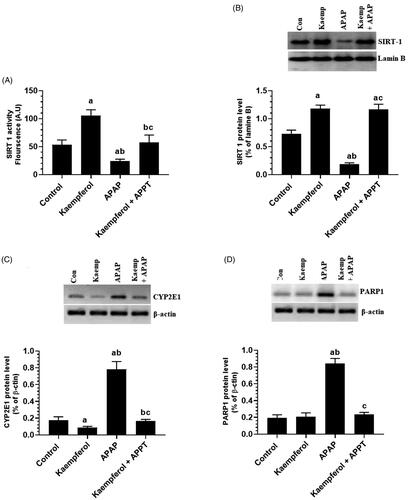
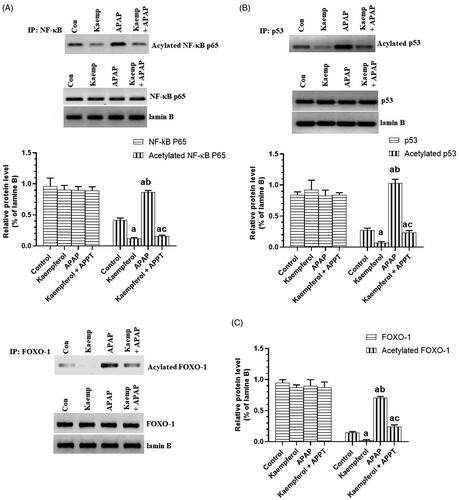
Figure 7. Total nuclear levels of NF-κB P65/acetylated NF-κB p65 (A), P53/acetylated p53 (B), FOXO-1/acetylated FOXO-1 (C) in the livers of all experimental groups. Values are expressed as mean ± SD (six rats/group). avs. control group. bvs. kaempferol-treated control group. cvs. APAP (acetaminophen)-treated rats.