Figures & data
Figure 1. Change in the body weight (BW) during the experiment/Body weights were measured every day. Data are represented as mean ± SD (n = 10). Data were analysed by one way analysis of variance (ANOVA). *p < 0.05: Significant difference in comparison with the control group. #p < 0.05: Significant difference in comparison with the BeSO4-treated group.
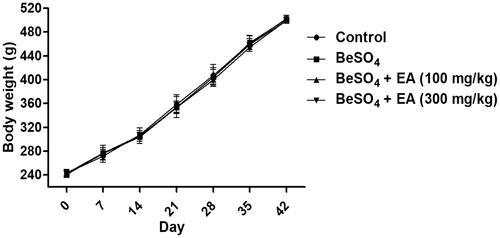
Table 1. Effect of EA on the spleen weight in BeSO4-intoxicant rats.
Table 2. Effect of EA on hematological parameters in BeSO4-intoxicant rats.
Figure 2. Effect of EA on splenocyte proliferation in BeSO4-intoxicant rats/Cultured splenocytes were suspended in RPMI-1640 complete medium containing 12% FBS, 100 U/mL penicillin and 100 µg/mL streptomycin, seeded into 96-well plates at 5 × 10⁴ cells/well and incubated with or without Con A (A) or LPS (B). Data are represented as mean ± SD (n = 5). Data were analysed by one way analysis of variance (ANOVA). *p < 0.05: Significant difference in comparison with the control group. #p < 0.05: Significant difference in comparison with the BeSO4-treated group.
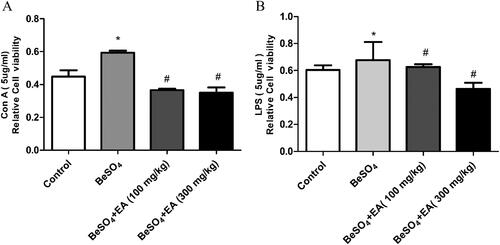
Figure 3. Effect of EA on GSH content, SOD activity and MDA level in BeSO4-intoxicant rats/GSH content was measured fluorometrically using orthophthalaldehyde (A). The SOD activity was measured using commercial ELISA kits (B). The level of MDA was measured using MDA assay kit (C). Data are represented as mean ± SD (n = 5). Data were analysed by one way analysis of variance (ANOVA). *p < 0.05: Significant difference in comparison with the control group. #p < 0.05: Significant difference in comparison with the BeSO4-treated group.
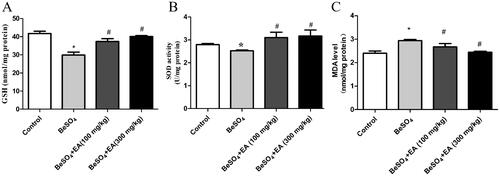
Figure 4. Effects of EA on apoptosis in BeSO4-intoxicant rats/Relative mRNA expression levels of Bax, Bcl-2, Caspase-3, and PARP are shown in ,,,). The expression levels of Bax, Bcl-2, Caspase-3, and PARP proteins were detected by western blotting are shown in . Data are represented as mean ± SD (n = 5). Data were analysed by one way analysis of variance (ANOVA). *p < 0.05: Significant difference in comparison with the control group. #p < 0.05: Significant difference in comparison with the BeSO4-treated group.
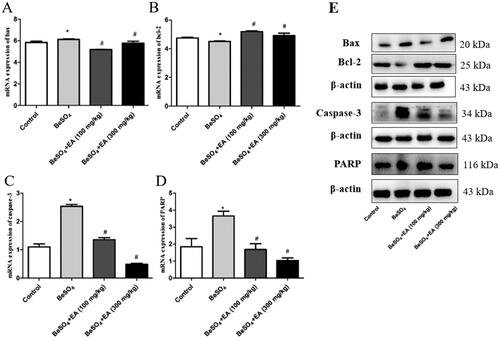
Figure 5. Histopathological observations showing effects of EA on BeSO4-induced changes in spleen/Spleen tissues were subjected to H&E staining. Microscopic images were taken at a magnification of 40 × (A–D), 200 × (E–H) and 400 × (I–L) for the spleen. White arrow: thickening of the marginal area; Black arrow: localized central dilatation of the spleen nodules; Yellow arrow: red pulp with blood stasis; Red arrow: nuclear fragmentation.
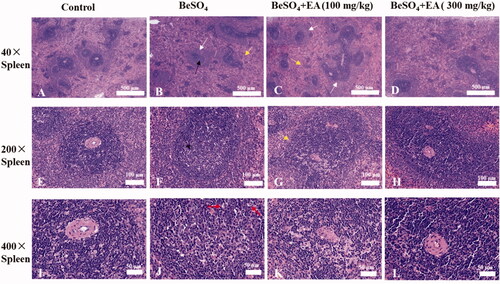
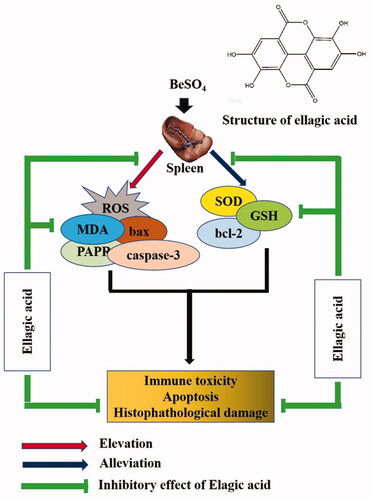
Figure 6. Proposed mechanism of ellagic acid against BeSO4-induced splenic toxicity.