
Figures & data
Figure 1. Drug-compounds-targets (D-C-T) network. (A) Venn diagram of active ingredients of RR and disease-related targets. (B) Protein-protein interaction (PPI) network diagram. The size of the node is proportional to the degree, and each edge represents the interaction between the compound molecule and the target. (C) The top 10 hub genes network. (D) D-C-T network diagram. The brown circles in the diagram are the key targets of RR acting on the disease, the hexagons represent active compounds and the red quadrilateral represents RR. The size of a node is proportional to its degree value.
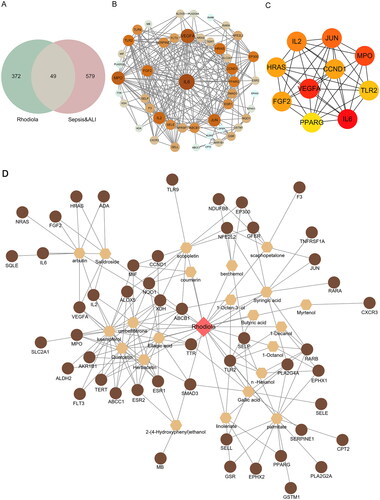
Figure 2. GO and KEGG enrichment analyses of 49 key targets. GO enrichment analysis of key targets in biological process (BP) (a), cellular component (CC) (B), and molecular function (MF) (C). KEGG pathway enrichment analysis of key targets (D).
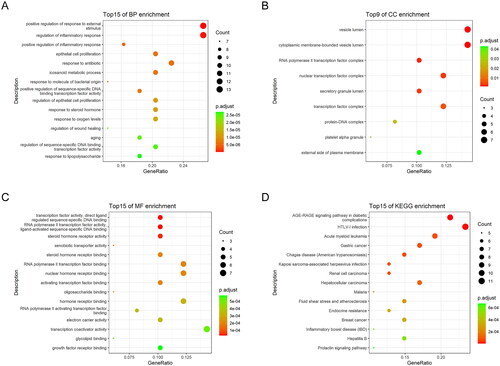
Figure 3. The top 20 pathways of hub genes.
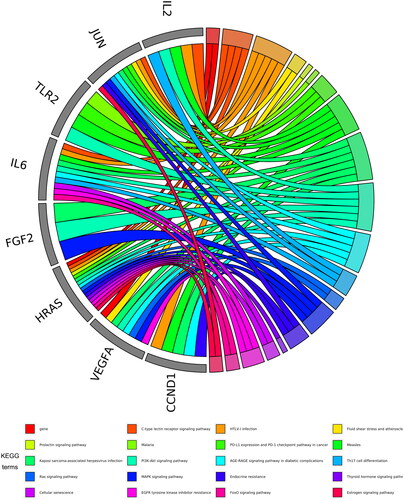
Figure 4. Map of the PI3K-AKT signalling pathway.
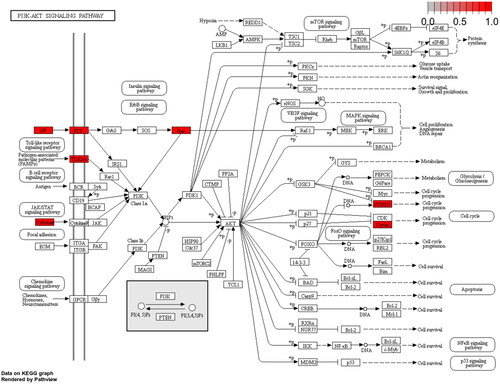
Table 1. The main ingredients of Rhodiola rosea L.
Table 2. The results of molecular docking.
Figure 5. Effects of RR on the viability, apoptosis, oxidative stress, and inflammatory response in LPS-stimulated human umbilical vein endothelial cells (HUVECs). (A) the viability of HUVECs was detected by CCK-8. The contents of inflammatory factors (B) and oxidative stress factors (C) in LPS-stimulated HUVECs were performed by enzyme-linked immunosorbent assay (ELISA). (D) The apoptosis of HUVECs was detected by flow cytometry. (E) The expression of p-PI3K/PI3K and p-AKT/AKT in LPS-stimulated HUVEC cells were examined using Western blotting. **p < 0.01 vs. Control group; #p < 0.05 and ##p < 0.01 vs. LPS group.
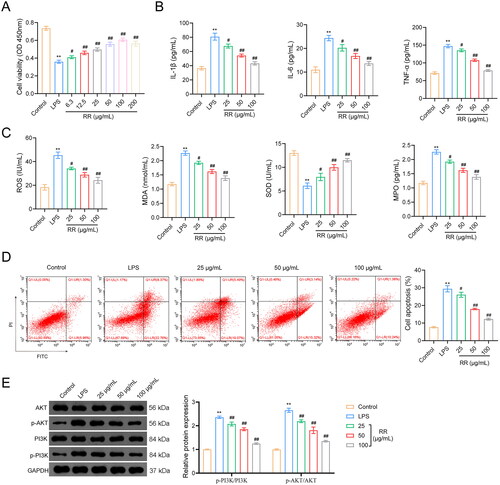
Figure 6. RR protected lung function and reduced sepsis-induced ALI in vivo. (A) The lung wet/dry (W/D) ratio. (B) Evans blue dye method was used to observe capillary permeability. (C) Haematoxylin-eosin (HE) staining for lung tissue pathological damage inspection. Scale bar: 50 μm. (D) The cell apoptosis in lung tissues using the TUNEL assay. Scale bar: 50 μm. **p < 0.01 vs. Sham group; #p < 0.05 and ##p < 0.01 vs. Model group.
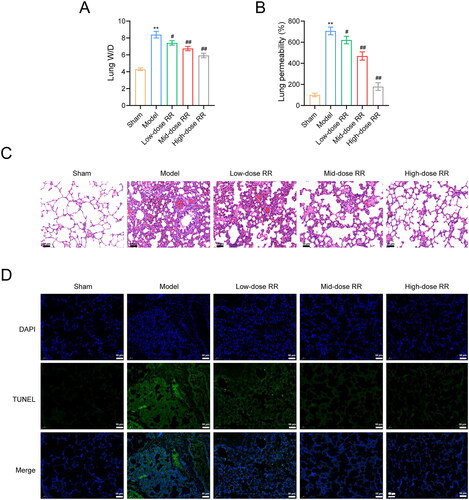
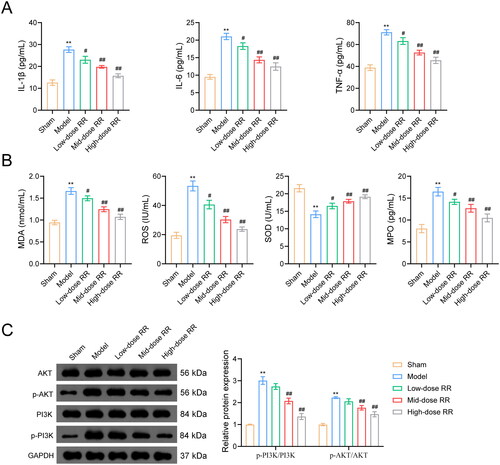
Figure 7. RR alleviated inflammation and oxidative stress, and inhibited activation of the PI3K-AKT pathway. ELISA assay was used to examine the effects of RR on the expression of inflammatory factors (A) and oxidative stress factors (B) in sepsis-induced ALI mice. (C) Western blot was used to detect the expression of p-PI3K/PI3K and p-AKT/AKT in lung tissues from sepsis-induced ALI mice. **p < 0.01 vs. Sham group; #p < 0.05 and ##p < 0.01 vs. Model group.
Supplemental Material
Download Zip (5.9 MB)Data availability statement
The data that support the findings of this study are available from the corresponding author, [LZ], upon reasonable request.