
Figures & data
Figure 1. Workflow of the network pharmacology-based study, designed to investigate the anti-hyperpigmentation mechanisms of THSWD. THSWD, Tao-Hong-Si-Wu decoction.
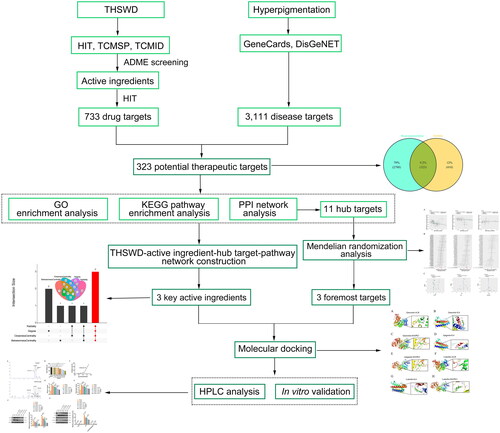
Table 1. The Gradient elution procedure for HPLC.
Table 2. Primary and secondary antibodies used in Western blotting.
Figure 2. Venn diagram of the THSWD-hyperpigmentation overlapping targets (A) and the THSWD-active ingredient-target network, constructed by cytoscape (B). THSWD, Tao-Hong-Si-Wu decoction.
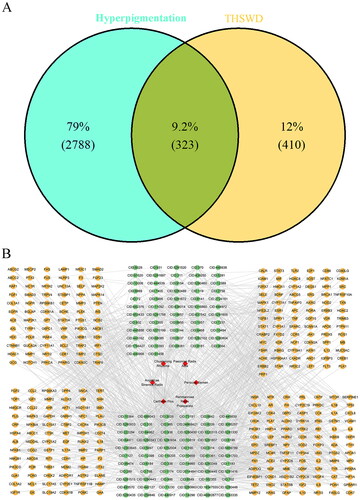
Figure 3. Histogram of 15 vitally enriched GO terms, including the top 5 BPs, CCs, and MFs. GO analysis was conducted using clusterProfifiler. P value < 0.01. GO: gene ontology; BP: biological process; CC: cellular component; MF: molecular function.
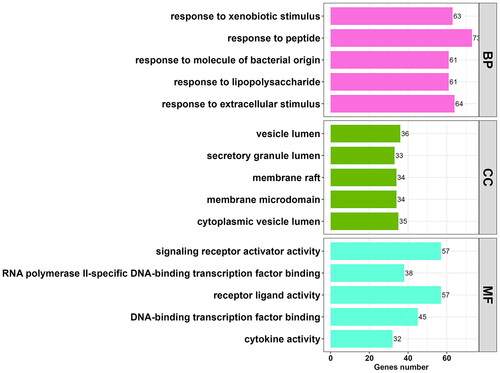
Table 3. Top 5 enriched BP, CC, and MF terms in GO enrichment analysis.
Figure 4. Bubble diagrams of the enriched KEGG pathways, including 25 terms belonging to environmental information processing (a), 65 to human diseases (B), and 49 to organismal systems (C). KEGG analysis was conducted using clusterProfifiler. P value < 0.01. KEGG: Kyoto encyclopedia of genes and genomes.
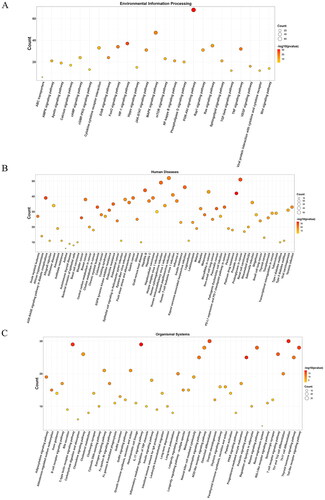
Figure 5. Bubble diagrams of the enriched KEGG pathways, including 12 terms belonging to cellular processes (a), 4 to metabolism (B), and 12 to others (C). KEGG analysis was conducted using clusterProfifiler. P value < 0.01. KEGG: Kyoto encyclopedia of genes and genomes.
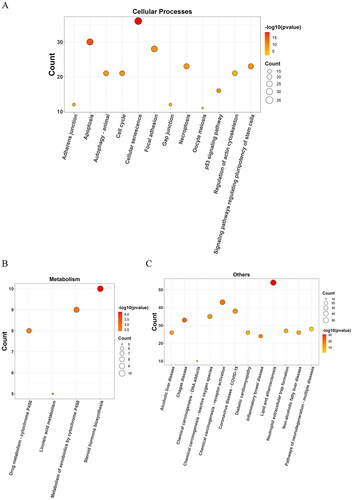
Figure 6. PPI network analysis of THSWD-hyperpigmentation overlapping targets. (A) PPI network, built by STRING database and visualized by cytoscape. (B-D) Selection of the top 20 hub targets from the PPI network using MNC, MCC, and EPC methods of cytoHubba. PPI: protein-protein interaction; THSWD: Tao-Hong-Si-Wu decoction; STRING: Search Tool for the Retrieval of Interacting genes/proteins; MNC: maximum neighborhood component; MCC: maximal clique centrality; EPC: edge percolated component.
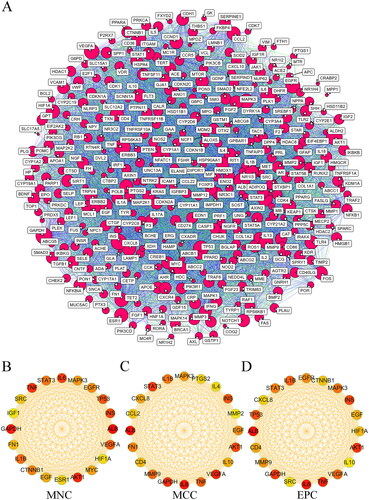
Figure 7. Screening the core targets and active ingredients. Venn diagram of overlapping hub targets based on MNC, MCC, and EPC methods (A), THSWD-active ingredient-hub target-pathway network, constructed by cytoscape (B), and overlapping core active ingredients screened by radiality, degree, closeness centrality, and betweenness centrality methods using UpSetR package (C). MNC: maximum neighborhood component; MCC: maximal clique centrality; EPC: edge percolated component; THSWD: Tao-Hong-Si-Wu decoction.
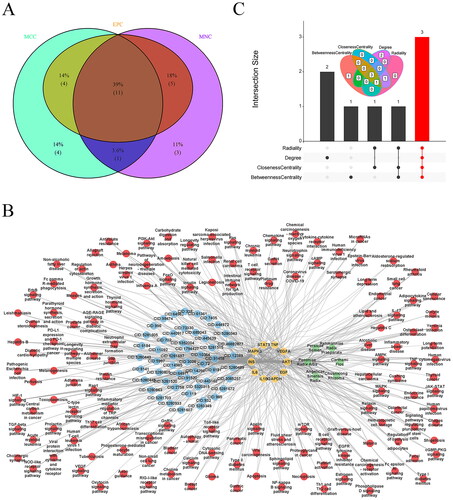
Table 4. The top 11 hub targets from the PPI network.
Figure 8. Mendelian Randomization analysis. Scatter plots demonstrating the causal effects of ALB, IL6, and MAPK3 on the risk of hyperpigmentation (a), Forest plots demonstrating the causal effects of ALB, IL6, and MAPK3 each SNP on the risk of hyperpigmentation (B), and funnel plots demonstrating the overall heterogeneity of MR estimates for the effects of ALB, IL6, and MAPK3 on hyperpigmentation (C). ALB: albumin; MAPK3: mitogen-activated protein kinase 3; SNP: single nucleotide polymorphism; MR: Mendelian randomization.
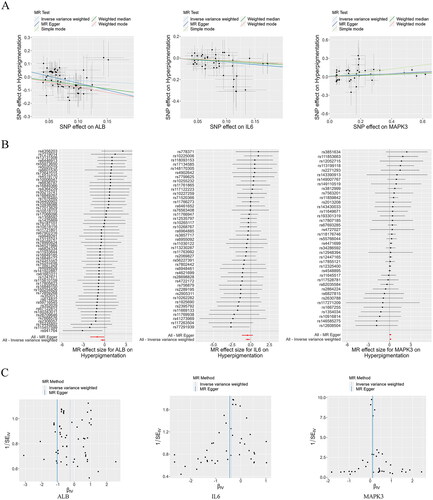
Figure 9. Molecular docking modes. Quercetin-ALB (a), quercetin-IL6 (B), quercetin- MAPK3 (C), apigenin-IL6 (D), apigenin-MAPK3 (E), luteolin-ALB (F), luteolin -IL6 (G), and luteolin-MAPK3 (H). Binding energy < -5 kcal/mol. ALB: albumin; MAPK3: mitogen-activated protein kinase 3.
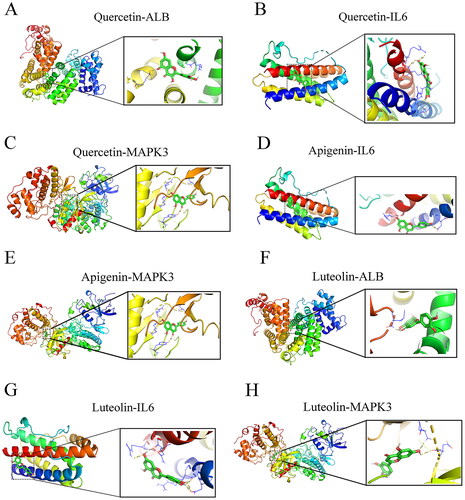
Table 5. Results of molecular docking.
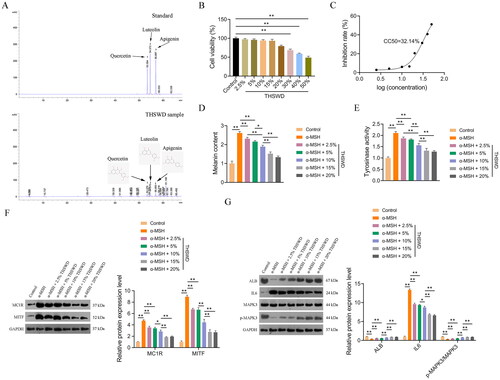
Figure 10. HPLC analysis and in vitro verification. Quality control and identification of key active ingredients of THSWD through HPLC analysis (a), determination of suitable treatment concentrations of THSWD (B), quantification of the CC50 of THSWD for PIG1 cells (C), assessment of melanin contents (D), assessment of tyrosinase activity (E), assessment of the expression of hyperpigmentation-related proteins, MC1R and MITF (F), and assessment of the expression of key targets, ALB, IL6, and MAPK3 (G). F-G: Protein expression levels were detected by Western blotting. Initially, the CCK-8 assay was used to investigate and determine the appropriate concentrations of THSWD treatment for subsequent assays. PIG1 cells were exposed to prepared serum THSWD (from SD rats) at gradient concentrations (2.5%, 5%, 10%, 15%, 20%, 30%, 40%, and 50%) for 24 h. PIG1 cells were treated with 100 nM α-MSH for 24 h to induce an in vitro model of hyperpigmentation. The model cells were treated with the appropriate concentrations of serum THSWD (2.5%, 5%, 10%, 15%, and 20%) determined for 48 h. All data are shown as mean ± standard deviation. *p < 0.05 and **p < 0.01. HPLC: high performance liquid chromatograph; CCK-8: cell counting kit-8; THSWD: Tao-Hong-Si-Wu decoction; CC50: 50% cytotoxicity concentration; ALB: albumin; MAPK3: mitogen-activated protein kinase 3.
Supplemental Material
Download Zip (355.3 KB)Data availability statement
The data that support the findings of this study are available from the corresponding author, [WY], upon reasonable request.