
Figures & data
Table 1. Subtests and number of words/utterances in DYMTA-A and DYMTA-B, respectively.
Table 2. Demographics and speech- language data for individual participants ordered by DYMTA-A scores within diagnostic groups..
Figure 1. Panel A and C illustrates performance on DYMTA-A total score and DYMTA-B total score, respectively, separately for children with CAS and nonCAS-SSD. In these figures, each individual is shown as a separate point. Panel B and D illustrates the ROC-curve for the DYMTA-A and DYMTA-B. Two potential cutoffs are illustrated in panel A, one based on the binomial logistic regression (dashed line) and one based on the positive likelihood ratio (dotted line) and the sensitivity and specificity pair related to these cutoffs are illustrated in panel B. Similarly, for panel C and D. The AUC is shown in panel B and D as the shaded area.
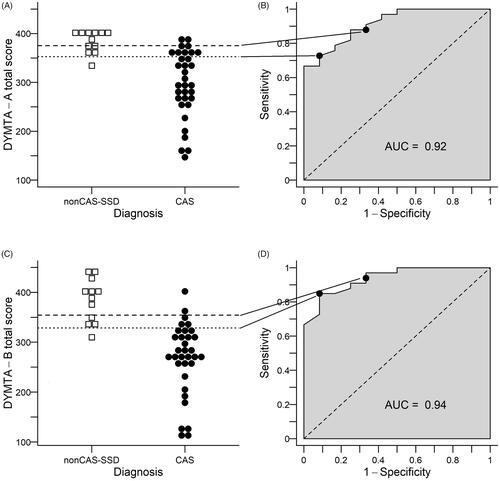
Table 3. Estimates of reliability for DYMTA-A and DYMTA-B total scores and subscores.
Table 4. Estimates of discrimination ability of DYMTA-A and DYMTA-B total scores and subscores.