1,052
Views
34
CrossRef citations to date
0
Altmetric
ORIGINAL ARTICLE

ECG changes in patients with acute ethanol intoxication

, , , &
Pages 79-84 | Received 24 Jun 2006, Published online: 12 Jul 2009

Figures & data

Figure 1.  Flow chart of patient selection in the study

Figure 1.  Flow chart of patient selection in the study

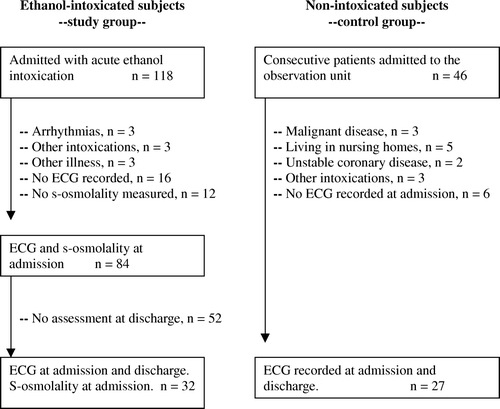
Table I.  Sample descriptive statistics at admission for patients admitted for acute ethanol intoxication and hospitalized controls, mean (SD) unless stated otherwise.

Table II.  ECG variables at admission according to serum osmolality as a proxy for ethanol level in combined sample of ethanol intoxicated and control group, adjusted marginal mean values (SE), adjusted for age, comorbidity, serum sodium and heart rate.

Table III.  Change in ECG between admission and discharge, mean (SD)

Reprints and Corporate Permissions

Please note: Selecting permissions does not provide access to the full text of the article, please see our help page How do I view content?

To request a reprint or corporate permissions for this article, please click on the relevant link below:

Academic Permissions

Please note: Selecting permissions does not provide access to the full text of the article, please see our help page How do I view content?

Obtain permissions instantly via Rightslink by clicking on the button below:

If you are unable to obtain permissions via Rightslink, please complete and submit this Permissions form. For more information, please visit our Permissions help page.