
Figures & data
Figure 1. Study flow chart. CTO: chronic total occlusion; PCI: percutaneous coronary intervention.
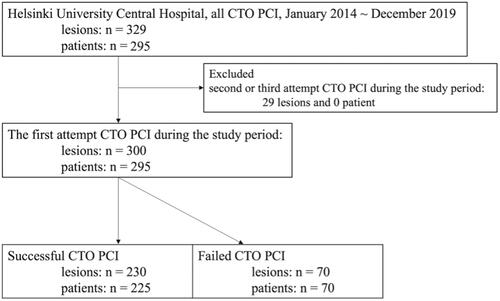
Table 1. Patient characteristics.
Table 2. Lesion characteristics.
Figure 2. Symptoms before and after the CTO PCI based on CCS classification. These figures showed the symptom based on CCS classification scale before PCI, after PCI, at 1 month, 6 months, 12 months, and the final follow-up in successful CTO PCI group (A) and failed CTO PCI group (B). The prevalence of symptoms before CTO PCI were compared to the prevalence at 12 months and at final follow up, and were classified as improved, no change, worsening, or TVR (C). CCS: Canadian Cardiovascular Society; CTO: chronic total occlusion; PCI: percutaneous coronary intervention; TVR, target vessel revascularization.
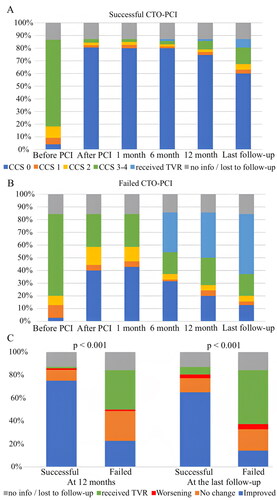
Figure 3. Symptoms before and after the CTO PCI based on study original questionnaire. Last follow-up duration varied among the patients, with a median of 37 (25–44) months in the successful group (A) (n = 202) and 33 (28–48) months in the failed group (B) (n = 60). CTO: chronic total occlusion; PCI: percutaneous coronary intervention.
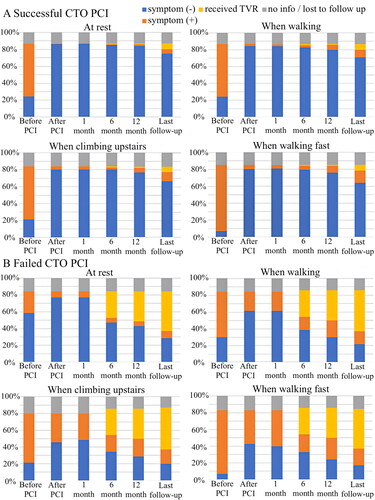
Table 3. Logistic regression model for symptom improvement at 12 months.
Table 4. Logistic regression model for improved symptoms at the final follow-up.
Figure 4. Kaplan–Meier curve for MACE and unplanned TVR among the patients without planned TVR. (A) Kaplan–Meier curve for MACE. (B) Kaplan–Meier curve for unplanned TVR. Patients with a planned second or third CTO PCI attempt (n = 25) were excluded from these analyses. MACE: major adverse cardiovascular event; TVR: target vessel revascularization; CTO: chronic total occlusion; PCI: percutaneous coronary intervention.
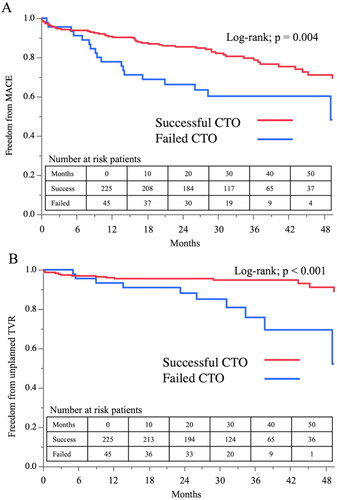
Table 5. Baseline characteristics of matched cohort.
Supplemental Material
Download MS Word (9.9 MB)Data availability statement
The data that support the findings of this study are available from the corresponding author, LM, upon reasonable request.