Figures & data
Table 1. Kaplan Meier Survival Graph.
Table 2. Fifteen patients with long-term follow-up data.
Table 3. Stimulation strategies and hearing outcomes.
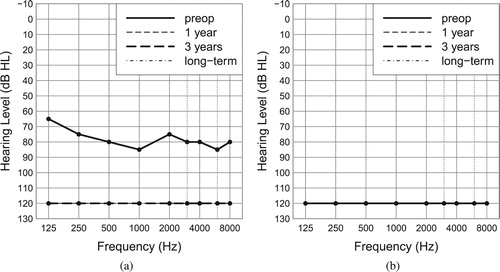
Figure 1. (a, b) Patient 1: (no long-term follow-up as patient moved to another area).
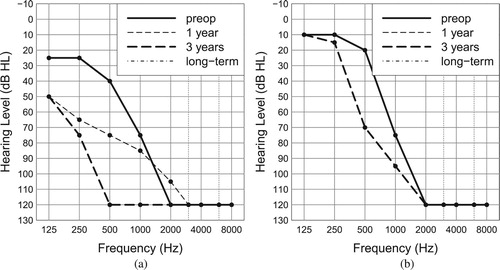
Figure 2. (a, b) Patient 2: 79% hearing preservation (HP).
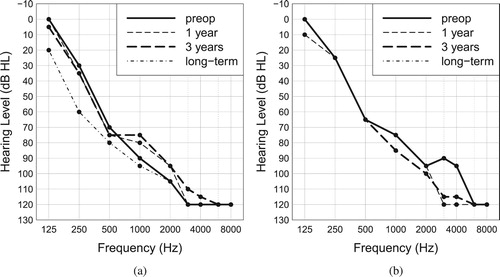
Figure 3. (a, b) Patient 3: 78% HP.
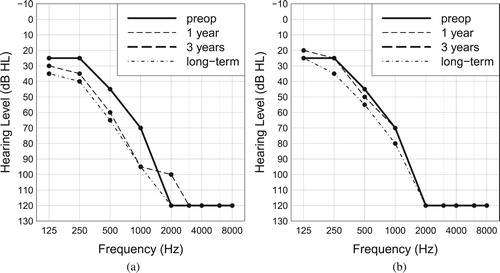
Figure 4. (a, b) Patient 4 (already had CI on the first ear, no long-term follow-up due to patient`s death).
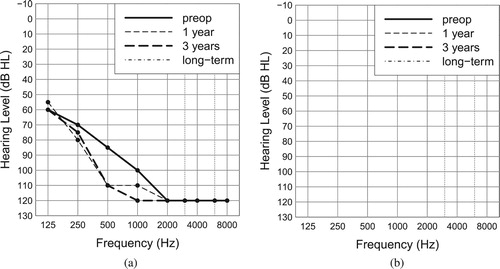
Figure 5. (a, b) Patient 5: 0% HP (already had CI on the first ear).
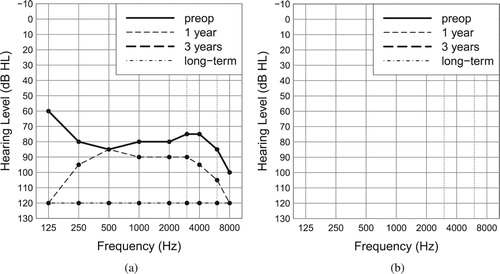
Figure 6. (a, b) Patient 6: 100% HP.
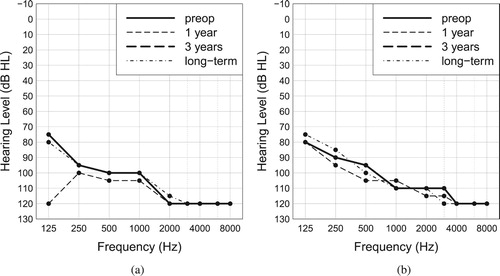
Figure 7. (a, b). Patient 7 (no long-term follow-up as patient moved to another area).
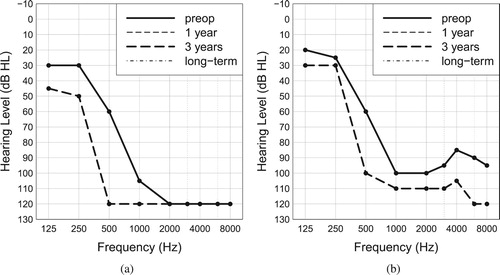
Figure 8 (a, b) Patient 8: 50% HP.
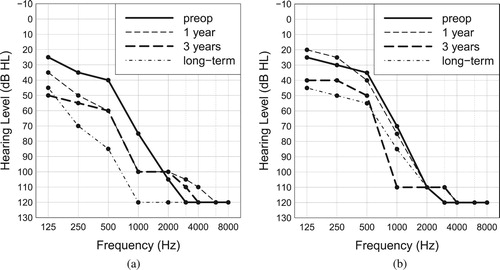
Figure 9 (a, b) Patient 9: 58% HP.
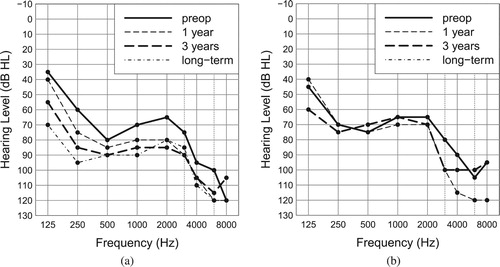
Figure 10 (a, b) Patient 10 (no long-term follow-up due to patient`s death).
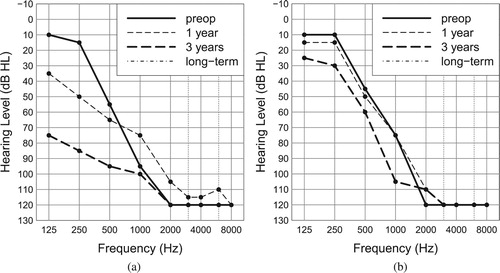
Figure 11 (a, b) Patient 11: 72% HP.
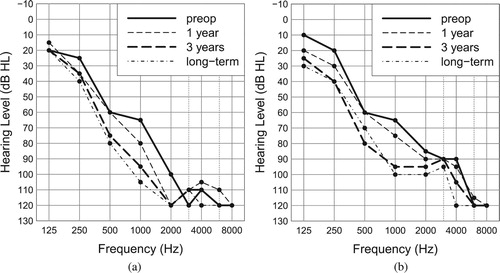
Figure 12 (a, b) Patient 12: 95% HP.
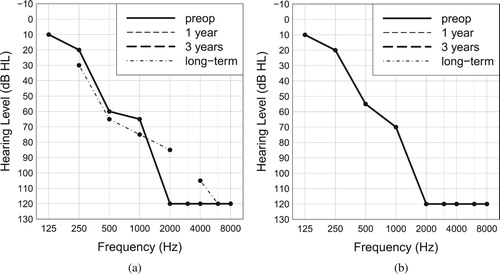
Figure 13 (a, b) Patient 13: 68% HP.
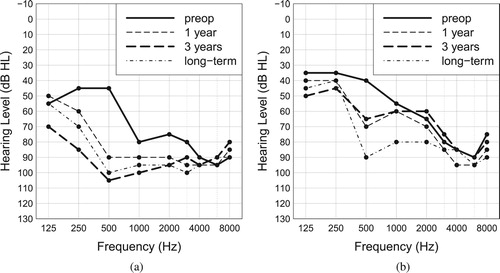
Figure 14 (a, b) Patient 14: 48% HP.
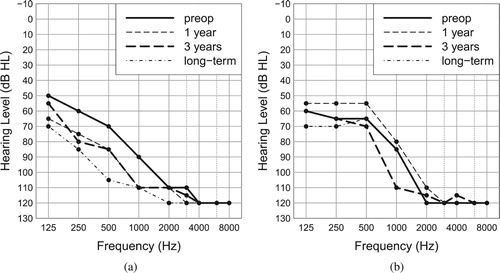
Figure 15 (a, b) Patient 15: excluded.
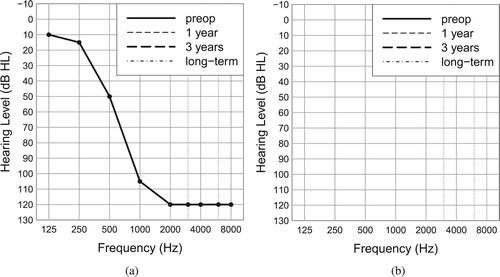
Figure 16 (a, b) Patient 16: 70% HP.
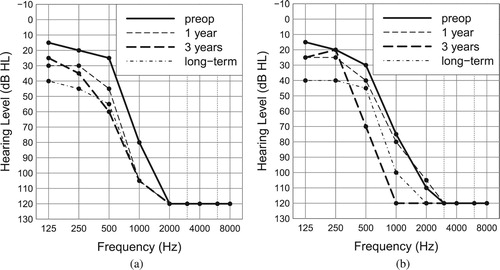
Figure 17 (a, b) Patient 17 (no long-term follow-up as patient moved to another area).
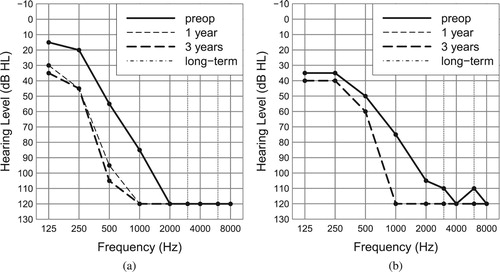
Figure 18 (a, b) Patient 18: 0% HP
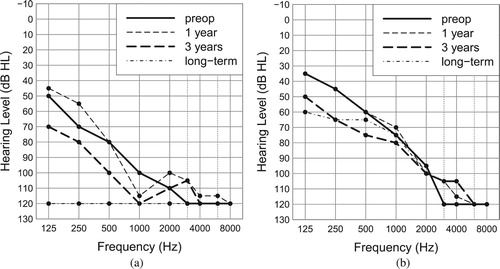
Figure 19 (a, b) Patient 19: 55% HP
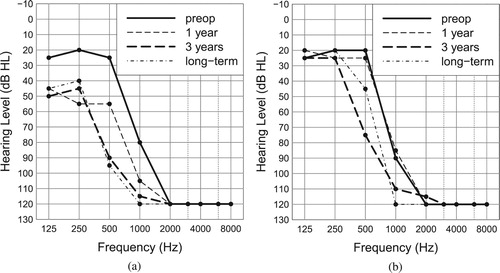
Figure 20 (a, b) Patient 20: 37% HP
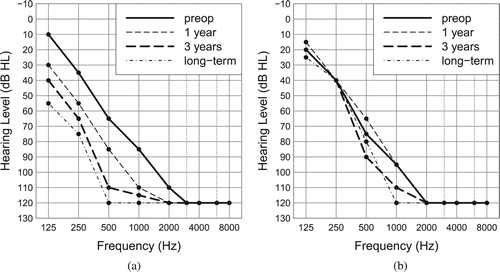
Figure 21 (a, b) Patient 21: 0% HP (single-sided deafness on the opposite side since childhood)