
Figures & data
Table 1 Demographics of the study participants. n refers to number of participants in each table and figure
Figure 1 Best, worst and average acoustic hearing thresholds measured in the contra-lateral ear before cochlear implantation, as were available from patient charts of 92 CI participants.
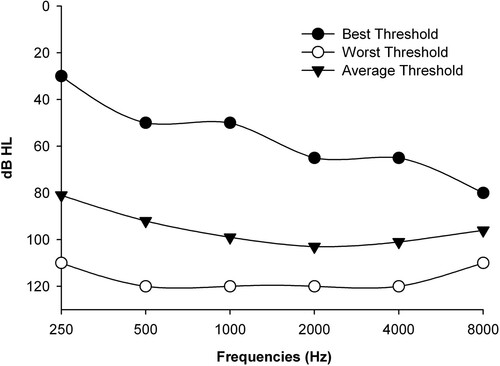
Figure 2 Self-reported music listening habits before (left box) and after implantation (right box), shown from 74 CI users and as measured by DMBQ. The total scores ranged from 2 (minimum music listening habits) to 8 (maximum music listening habits). The 25th–75 th percentile is presented by the boxes, the median values by the lines, and the 10th–90 th percentile by the error bars. The dots are the outliers.
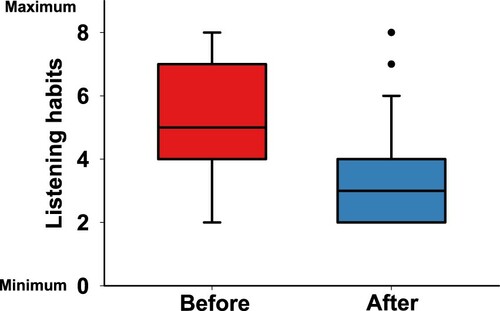
Figure 3 The self-reported quality of music, scored between 0 (worst) and 100 (best), shown as averaged (rightmost hatched box) and shown separately for the seven descriptor pairs (blue boxes), shown for N = 97 of the DMBQ. The combined total score, averaged across the seven scales, is shown by the rightmost box. The boxes represent the distributions as described in .
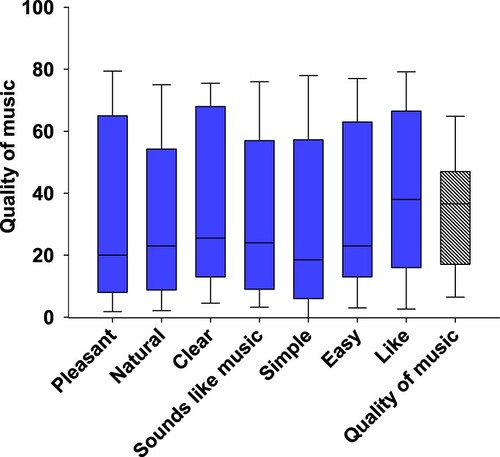
Figure 4 The differentiation and recognition of the elements of music, shown in percentages of the respondents who reported a positive (i.e. 5–7), neutral (i.e. 4), or negative ability (i.e. 1–3), shown for N = 87 as measured by DMBQ.
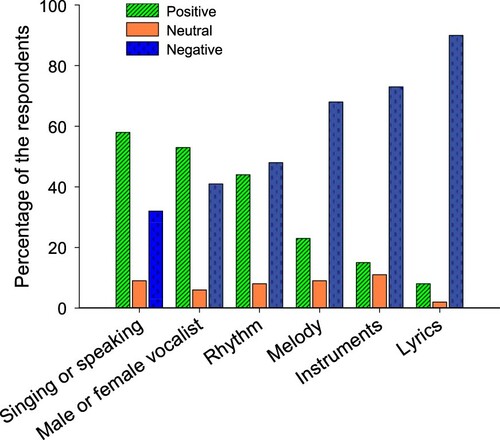
Table 2 Mean scores and standard deviations of the domains and total scores of the NCIQ (between 0 and 100)
Table 3 Mean scores and standard deviations of the domains and total scores of the SSQ (between 0 and 10)
Table 4 Multiple linear regression results from comparisons between NCIQ, SSQ, phoneme-in-word recognition scores (speech 65; speech75) and the DMBQ measures, listening habits pre- and post-CI, quality of the sound of music and elements of music. N = Number of respondents. Entries marked with gray show the significant outcomes