Figures & data
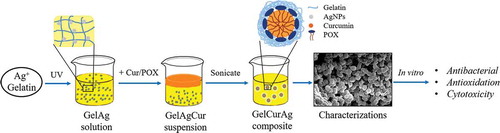
Figure 1. General schematics of methodology: (a) the fabrication of GelAg solution and (b) the encapsulation of curcumin using GelAg solution.
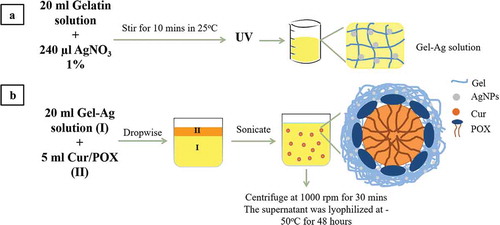
Table 1. Formulation compositions (weight basis) for the preparation of GelCurAg.
Figure 2. UV–vis absorbance of (a) GelAg solutions: (a) Gel0.5Ag, (b) Gel0.75Ag, (c) Gel1Ag and (d) Gel1.25Ag; (b) Gel1Cur, Gel1Ag and Gel1CurAg and (c) Gel0.5CurAg, Gel0.75CurAg, Gel1CurAg and Gel1.25CurAg.
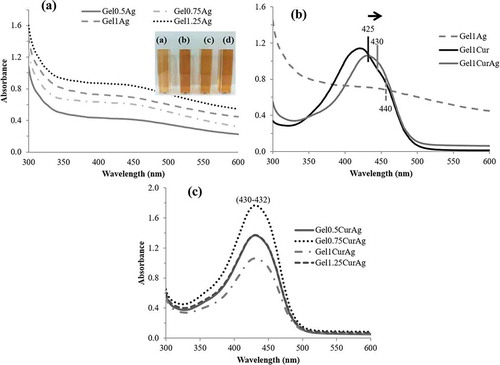
Table 2. Analysis of particle size and stability of GelCurAg composites.
Figure 3. SEM micrographs of (a) Gel0.5CurAg, (b) Gel0.75CurAg, (c) Gel1CurAg and (d) Gel1.25CurAg. Scale bar: 5 µm.
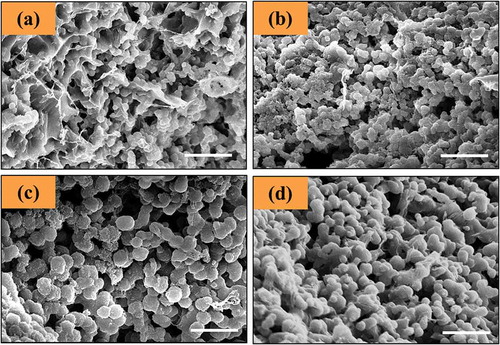
Figure 4. Quantitative analysis of AgNPs within GelCurAg composites.
Table 3. The loading efficiency of curcumin in the studied GelCurAg formulations.
Figure 5. X-ray diffraction patterns of curcumin (black) and GelCurAg lyophilized powders.
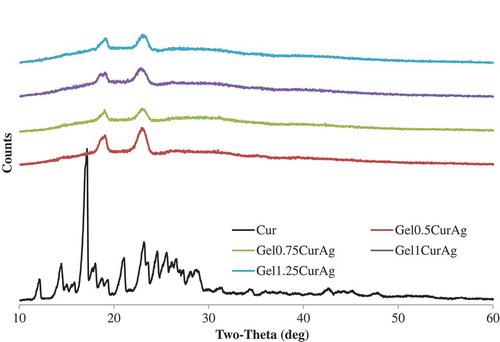
Figure 6. Drug release rate of GelCurAg samples.
Figure 7. Images of (a) inhibition zone of GelCur and GelCurAg and (b) their measured inhibitory zones against S. aureus and P. aeruginosa.
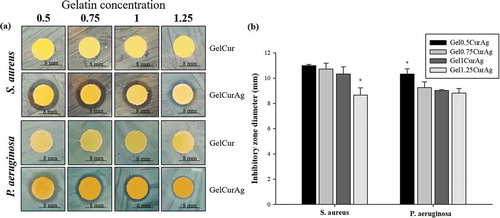
Figure 8. The bactericidal and inhibitory effects against (a) S. aureus and (b) P. aeruginosa of different concentration of (a) Gel0.5CurAg, (b) Gel0.75CurAg, (c) Gel1CurAg and (d) Gel1.25CurAg (MIC [inhibitory] – red; MBC [bactericidal] – black).
![Figure 8. The bactericidal and inhibitory effects against (a) S. aureus and (b) P. aeruginosa of different concentration of (a) Gel0.5CurAg, (b) Gel0.75CurAg, (c) Gel1CurAg and (d) Gel1.25CurAg (MIC [inhibitory] – red; MBC [bactericidal] – black).](/cms/asset/5ffdaf30-b072-4b60-8341-d75e96a9e23a/tsta_a_1585131_f0008_oc.jpg)
Table 4. Summary of antibacterial activities of four GelCurAg samples against S. aureus and P. aeruginosa (unit: µl/ml).
Table 5. Summary of the results of in vitro performances of GelCurAg composites.
Figure 9. Images of (a) antioxidant activities of different concentration of GelCurAg suspensions through decoloring of DPPH solution and (b) their corresponding percentage of oxidation inhibition after 90 min incubation.
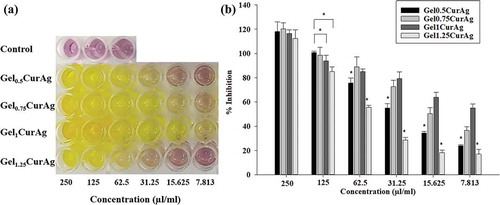
Figure 10. MTT results of different concentration of GelCurAg samples.