Figures & data
Figure 1 Effect of dilution on RMAK activity. A 2000 nM RMAK solution in 0.1 M potassium phosphate, pH 8.0 (▪) was diluted with buffer to 200 nM RMAK (▪), 25 nM RMAK (▴) and 6 nM RMAK (▵). Activities were measured after dilution and then with time. The relative activities of 1.0 at 0 min were estimated as the determined activity of 2000 nM RMAK stock solution divided by the appropriate dilution.
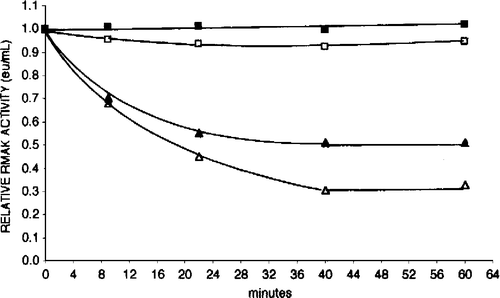
Figure 2 Dilution and aldolase effect relationships between RMAK concentrations and activity. A 2000 nM RMAK solution in 0.1 M potassium phosphate, pH 8.0 was diluted to concentrations shown, incubated at 25 °C for 1 h and activities then determined (▪). Similar dilutions and conditions were made except that they also were made 500 nM aldolase (▪). The dotted line is the expected linear relationship.
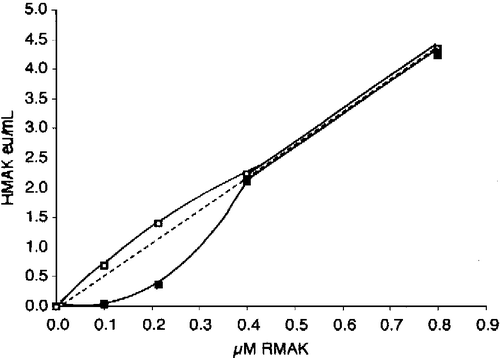
Table I. Effect aldolase on RMAK concentrations/activity ratios
Figure 3 The effect of aldolase concentration on RMAK activity. Dilutions of RMAK were made with aldolase in 0.1 M potassium phosphate, pH 8. The values in brackets show control RMAK activities after dilution and after 1 h incubation with no aldolase. Values in the brackets are stable RMAK activities after 1 h incubation following dilution. A 2000 nM RMAK solution was diluted to 25 nM RMAK, incubated for 1 h, and activity determined (▵) [0.03 eu/mL]. Similar procedures were performed for, 50 nM (▪) [0.07 eu/mL], 100 nM (▪) [0.33 eu/mL], 200 nM (▴) [0.460 eu/mL], and 400 nM RMAK (•) [1.18 eu/mL].
![Figure 3 The effect of aldolase concentration on RMAK activity. Dilutions of RMAK were made with aldolase in 0.1 M potassium phosphate, pH 8. The values in brackets show control RMAK activities after dilution and after 1 h incubation with no aldolase. Values in the brackets are stable RMAK activities after 1 h incubation following dilution. A 2000 nM RMAK solution was diluted to 25 nM RMAK, incubated for 1 h, and activity determined (▵) [0.03 eu/mL]. Similar procedures were performed for, 50 nM (▪) [0.07 eu/mL], 100 nM (▪) [0.33 eu/mL], 200 nM (▴) [0.460 eu/mL], and 400 nM RMAK (•) [1.18 eu/mL].](/cms/asset/eae70325-55c5-4bad-a4de-eaa1fb02b7c8/ienz_a_104320_f0003_b.gif)
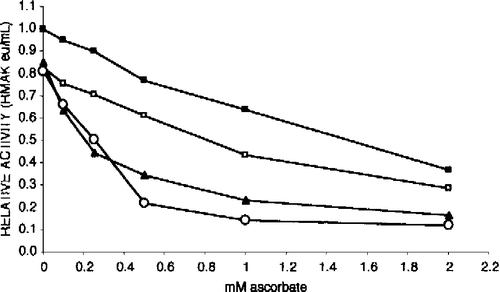
Figure 4 Effect of RMAK concentration on inhibition by ascorbate. Each RMAK concentration shown was diluted from 2000 nM RMAK in 0.1 M potassium phosphate, pH 8.0. Controls without ascorbate were incubated 1 h and activities determined are given within parentheses. Following that 1 h incubation aliquots of each RMAK concentration was made to ascorbate concentrations indicated, and activities remaining determined after an additional 1 h incubation. RMAK activities just prior to the ascorbate additions are with the symbols in parentheses. The RMAK concentrations were 400 nM (○, 1.51 eu/mL); 300 nM (▵, 1.13 eu/mL); 200 nM (•, 0.76 eu/mL); 100 nM (▪, 0.39 eu/mL); 50 nM (▴, 0.21 eu/mL); and 25 nM (▪, 0.08 eu/mL).
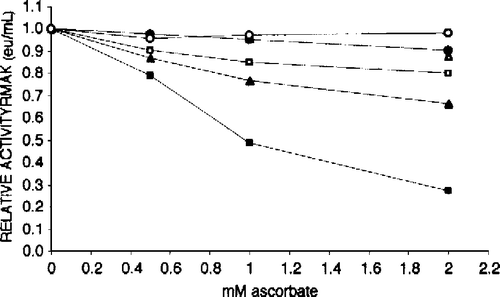
Figure 5 Aldolase protects RMAK from dilution effects. A 2000 nM RMAK in 0.1 M potassium phosphate, pH 8.0 was diluted to 20 nM RMAK as given in and then made 5 μM aldolase by additions to aliquots of the 0 time control (▪) at times indicated and activities remaining were determined. Each addition was then followed with time up to 120 min. The times of aldolase additions were 5 min (▪), 10 min (▴), 20 min (▵), 30 min (•) and 60 min (○). Additions of concentrated aldolase solutions to aliquots were less than 5 percent of the total aliquot volume.
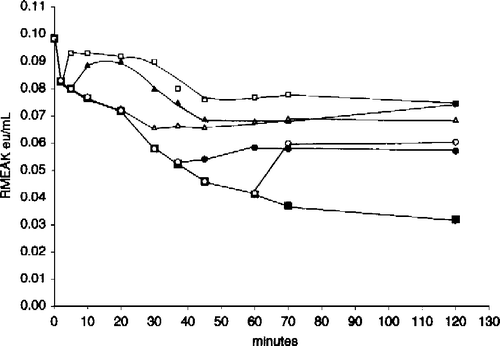
Figure 6 Aldolase protects RMAK from dilution effects. A 2000 nM RMAK solution in 0.1 M potassium phosphate, pH 8.0 was diluted to 6.7 nM RMAK with the buffer. After 0 min (▪), aliquots were removed at 5 min (▪), 10 min (▴) and 60 min (○), the aliquots were made 5 μM aldolase without significant dilution and the activity remaining was followed with time.
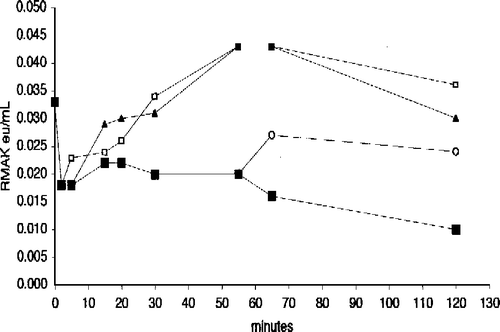
Figure 7 Effect of muscle aldolase and G-actin on 20 nM RMAK in the presence and absence 2 mM ascorbate. A 2000 nM RMAK solution was diluted to 20 nM RMAK with 0.02 M potassium phosphate, pH 8.0 buffer (▪) and activity followed with time. At 15 min (arrow), aliquots were made 5 μM muscle aldolase (•) or 5 μM G-actin (▴) and activity was followed with time. Also at 0-min, a 2000 nM RMAK solution was diluted to 20 nM RMAK in buffer and 2 mM ascorbate (▪) and at 15 min (arrow), aliquots were made 5 μM muscle aldolase (○) or 5 μM G-actin (▵) and activity was followed with time.
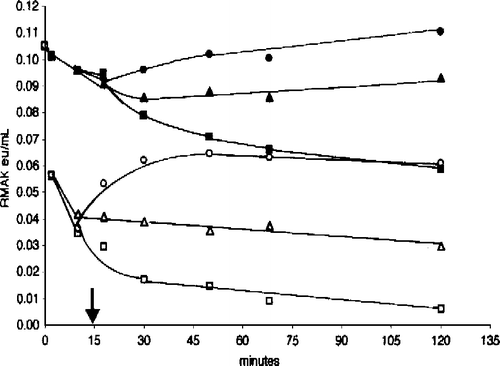
Figure 8 Effect of muscle aldolase, bovine serum albumin, and myosin on 2 mM ascorbate inhibition of 20 nM RMAK. A 2000 nM RMAK in 0.02 M potassium phosphate, pH 8.0, was diluted to 20 nM RMAK. 1 h later the 20 nM RMAK was made 2 mM ascorbate and activities were followed with time (▪). At 15 min, aliquots were made 5 μM muscle aldolase (•) or 5 μM myosin (▴) or 5 μM bovine serum albumin (X) and activities were followed with time.
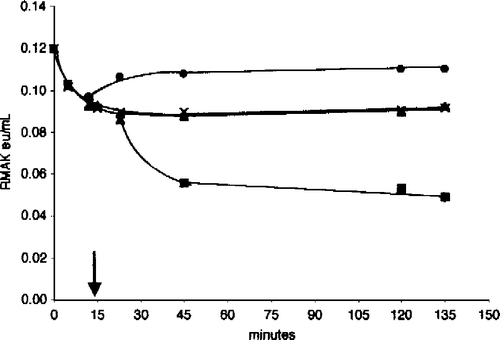
Figure 9 Substrates increase 25 nM RMAK sensitivity to ascorbate inhibition. The activity of the control, 25 nM RMAK in 0.1 M potassium phosphate, pH 8.0, stabilized by 1 h (▪, 0.07 eu/mL). At that time aliquots of the control were made to ascorbate concentrations indicated. In addition to ascorbate, solutions contained the following, 0.45 mM AMP (▪); 0.5 mM ATP (▴); and 0.5 mM ATP.Mg (○) and were made to ascorbate concentrations indicated, then incubated for an additional 1 h when activities remaining were determined.