Figures & data
Scheme 1 Synthesis of arylderivatives 1, 2, 3 and 4.
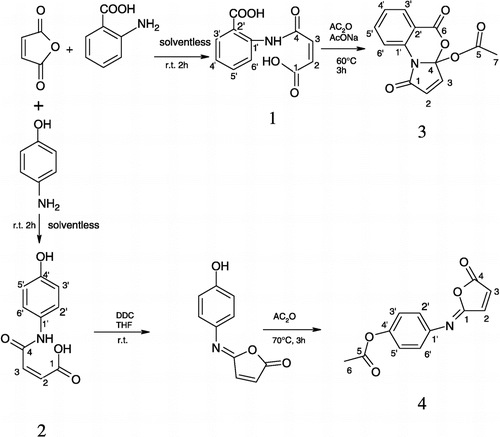
Table I. Inhibitory effects of 3 and 4 on AChE activity.
Figure 1 Time and concentration dependent inhibition on AChE activity for 4. Plot A shows the progressive development of inhibition produced by reaction of AChE with four different concentrations of 4, plotted as a semilogarithmic curve in accordance with Equation 1. The results are the mean ± S. E. of three experiments, each one being performed in duplicate. There was a significant difference (*P < 0.05) in relation to the control (without inhibitor). Plot B shows the relationship between the Kapp − 1 versus [I]− 1. The plot was made in accordance with Equation 2.
![Figure 1 Time and concentration dependent inhibition on AChE activity for 4. Plot A shows the progressive development of inhibition produced by reaction of AChE with four different concentrations of 4, plotted as a semilogarithmic curve in accordance with Equation 1. The results are the mean ± S. E. of three experiments, each one being performed in duplicate. There was a significant difference (*P < 0.05) in relation to the control (without inhibitor). Plot B shows the relationship between the Kapp − 1 versus [I]− 1. The plot was made in accordance with Equation 2.](/cms/asset/9f81bca3-d49b-4065-b56e-1cd2f1ea2b31/ienz_a_148008_f0002_b.gif)
Figure 2 Dialysis kinetic method that shows time dependent AChE activity: full circles = without inhibitors; triangles = 3+ edrophonium; clear circles = 3. Each value represents the mean ± S. E. n = 6, *P < 0.05 in respect to the control (without inhibitors).
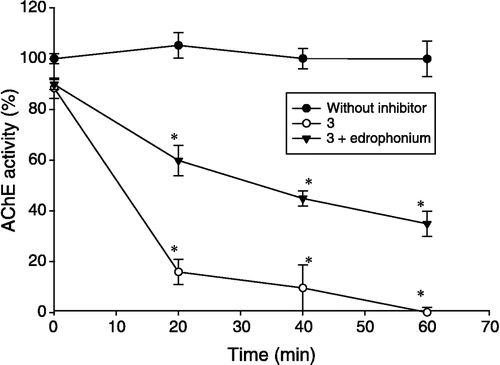
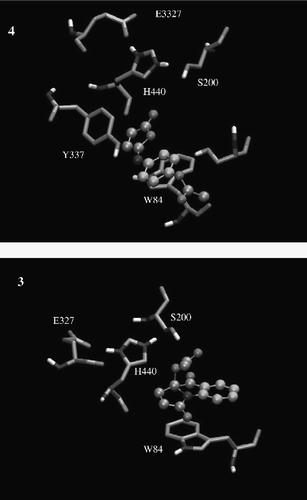
Figure 3 Graphical representations of the binding modes of compounds 3 and 4 in the catalytic site of AChE (PDB 1B41).