Figures & data
Figure 1 Plot of the integrated form of the Michaelis equation to a progress curve containing S. maltophilia DHFR (22 pM), NADPH (100 μM) and DHF (10 μM) at pH 7.4.
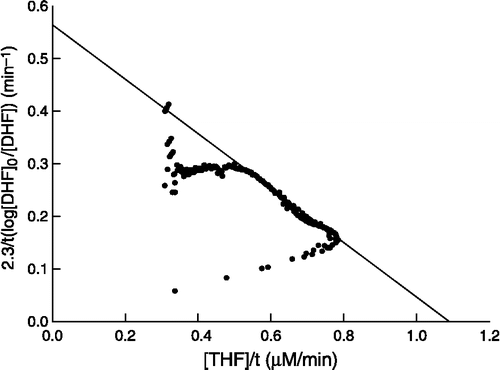
Figure 2 Inhibition of S. maltophilia DHFR activity by MTX at pH 7.4. (A) Experimental reaction progress curves at inhibitor concentrations of 0, 0.2, 0.6, 1.0, and 1.5 nM. The experimental conditions were: DHFR 40 pM; NADPH 100 μM and DHF 10 μM. (B) Replot of kobs versus MTX concentration. kobs values are derived from the progress curves as described in Equation (1). (C) Dependences of v0 (filled circles) and vs (open circles) on MTX concentration. Solid lines represent the dependence of both parameters in simulation experiments. (D) Simulated reaction progress curves at inhibitor concentrations of 0, 0.2, 0.6, 1.0, and 1.5 nM. Concentration of enzyme and substrates were as for experimental results and the rate constants used for simulation of the mechanism of were as described in with .
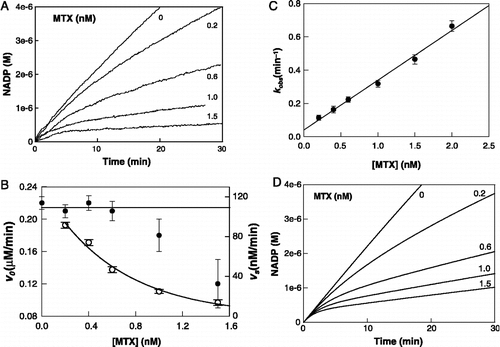
Table I. Different mechanisms to explain slow-binding inhibition of S. maltophilia by MTX.
Table II. Possible mechanisms for the slow-binding inhibition of S. maltophilia DHFR assuming an initial slow-binding process and their relationship to the apparent first-order rate constant (kobs) and steady-state rates v0 and vs. (E= DHFR, A= NADPH; B= DHF and I= MTX).
Table III. Kinetic constants for the reaction of S. maltophilia DHFR with NADPH and DHF at 25°C, pH 7.4, and its inhibition by MTX.
Table IV. Possible mechanism for the slow-binding inhibition of DHFR (E) assuming the formation of a slow dissociating complex after the reaction of NADPH (A) with the enzyme-inhibitor complex. B represents DHF and I is MTX.