1,256
Views
23
CrossRef citations to date
0
Altmetric
Research Article

Kinetic, thermodynamic and statistical studies on the inhibition of adenosine deaminase by aspirin and diclofenac

, , , , , , & show all
Pages 395-406 | Received 01 Sep 2006, Published online: 04 Oct 2008

Figures & data

Figure 1 Double reciprocal Lineweaver–Burk plots for kinetics of 0.94 nM ADA at pH = 7.5 in the presence of 0.0 (▪), 7.5? (▪), 15.0 (▴), 22.5 (▵) and 30.0 μM (() of (a) aspirin at 27°C and (b) diclofenac at 37°C. Inset of each figure (secondary plots): apparent Michaelis constant, K'm (Km,app) versus concentration of inhibitor, [I].

Figure 1 Double reciprocal Lineweaver–Burk plots for kinetics of 0.94 nM ADA at pH = 7.5 in the presence of 0.0 (▪), 7.5? (▪), 15.0 (▴), 22.5 (▵) and 30.0 μM (() of (a) aspirin at 27°C and (b) diclofenac at 37°C. Inset of each figure (secondary plots): apparent Michaelis constant, K'm (Km,app) versus concentration of inhibitor, [I].

Figure 2 ΔHo versus KI for first 10 injections, according to Equation (2) for (a) aspirin (b) diclofenac. The coordinates of intersection point of curves give true values for ΔHo and KI.
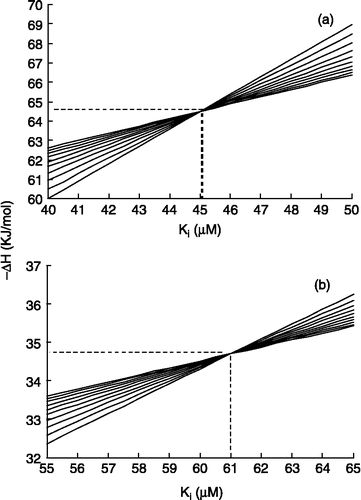
Figure 2 ΔHo versus KI for first 10 injections, according to Equation (2) for (a) aspirin (b) diclofenac. The coordinates of intersection point of curves give true values for ΔHo and KI.

Scheme 1 Molecular structure of a) nucleoside and b) non-nucleoside inhibitors.

Scheme 1 Molecular structure of a) nucleoside and b) non-nucleoside inhibitors.

Table I.  List of descriptors used in this work.

Table II.  Values of descriptors was calculated by Hyperchem-7.0 and Dragon-3.0.

Table II. continued. 

Figure 3 The linear correlation between the experimental values of logKI and the related values of the prediction set by MLR analysis on descriptors.
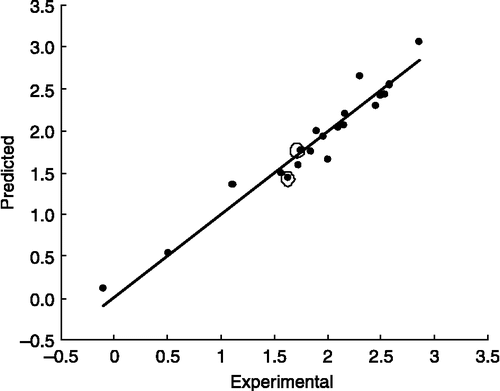
Figure 3 The linear correlation between the experimental values of logKI and the related values of the prediction set by MLR analysis on descriptors.

Table III.  Rotated component matrix for studied descriptors.

Table IV.  Specification of the multiple linear regression model for factors.
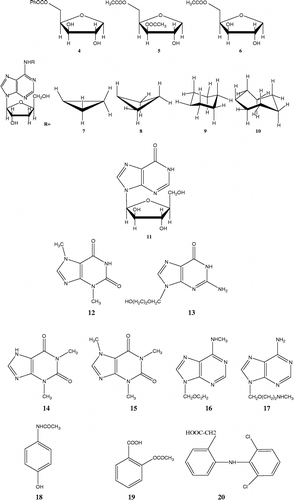
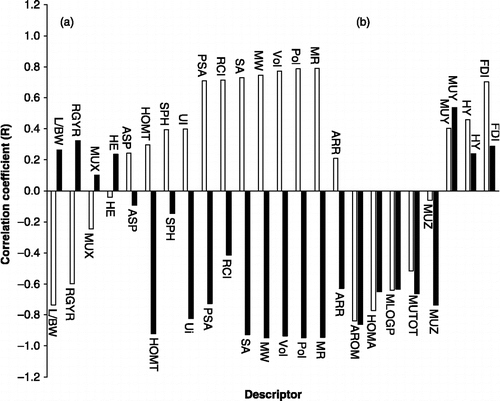
Figure 4 Correlation coefficients logKI and descriptors for nucleoside (black) and non-nucleoside (white) bar line.

Figure 4 Correlation coefficients logKI and descriptors for nucleoside (black) and non-nucleoside (white) bar line.

Reprints and Corporate Permissions

Please note: Selecting permissions does not provide access to the full text of the article, please see our help page How do I view content?

To request a reprint or corporate permissions for this article, please click on the relevant link below:

Academic Permissions

Please note: Selecting permissions does not provide access to the full text of the article, please see our help page How do I view content?

Obtain permissions instantly via Rightslink by clicking on the button below:

If you are unable to obtain permissions via Rightslink, please complete and submit this Permissions form. For more information, please visit our Permissions help page.