Figures & data
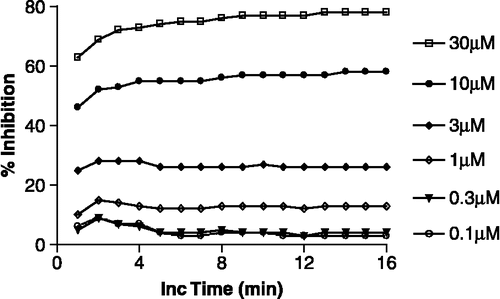
Figure 1 Graphic representation of the percent inhibition of CA-II by ZNS as a function of the concentration of ZNS and the incubation (Inc) time after initiation of the enzymatic reaction (4-NPA hydrolysis assay). The increase in the optical density was monitored at 1-minute intervals. The data derive from one experiment performed in quadruplicate.

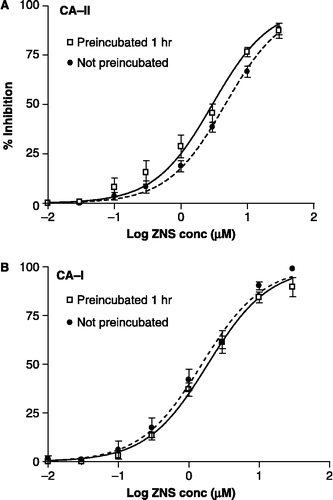
Figure 2 Concentration–inhibition graphs illustrating the effect of preincubation on the inhibition of CA-II and CA-I by ZNS (4-NPA assay). The data are the mean ( ± SEM) of 4 or 5 experiments, each of which was performed in quadruplicate. The curve-fit analysis of the data assumed normal saturation and one-site competition. Filled circles are paired with the dashed line.

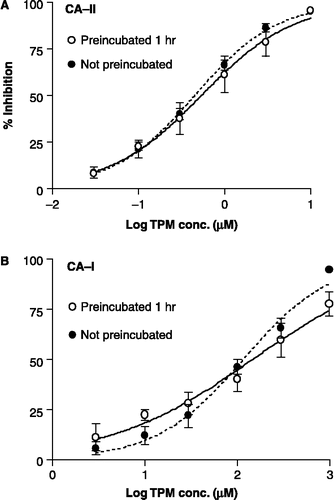
Figure 3 Concentration–inhibition graphs showing the effect of preincubation on the inhibition of CA-II and CA-I by TPM (4-NPA assay). The data are the mean ( ± SEM) of 4 or 5 experiments (each done in quadruplicate). The curve-fit analysis of the data was performed with a sigmoidal saturation equation that allows for a variable slope. Filled circles are paired with the dashed line.

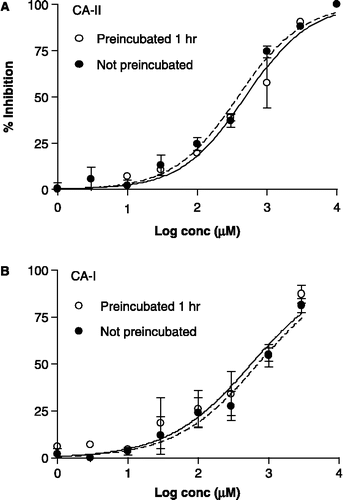
Figure 4 Concentration–inhibition graphs illustrating the effect of preincubation on the inhibition of CA-II and CA-I by 3 (4-NPA assay). The data are the mean ( ± SEM) of 3 or 6 experiments (each done in quadruplicate). The curve-fit analysis of the data was performed using a sigmoid saturation equation that allows for a variable slope. Filled circles are paired with the dashed line.

Figure 5 Concentration–inhibition graphs depicting the inhibitory effect of 3 on the activity of human CA-II and CA-I as determined with a CO2 hydration assay (described in detail previously[Citation15]), instead of the 4-NPA assay. The data are the mean ( ± SEM) of 2–6 experiments (each performed in triplicate). The curve-fit analysis of the data was performed with a sigmoidal saturation equation that allowed for a variable slope and variable maximum % inhibition. The Ki was 2.4-fold and 4.6-fold lower than the IC50 for CA-II and CA-I, respectively.
![Figure 5 Concentration–inhibition graphs depicting the inhibitory effect of 3 on the activity of human CA-II and CA-I as determined with a CO2 hydration assay (described in detail previously[Citation15]), instead of the 4-NPA assay. The data are the mean ( ± SEM) of 2–6 experiments (each performed in triplicate). The curve-fit analysis of the data was performed with a sigmoidal saturation equation that allowed for a variable slope and variable maximum % inhibition. The Ki was 2.4-fold and 4.6-fold lower than the IC50 for CA-II and CA-I, respectively.](/cms/asset/cbdcbee2-e0bb-43e4-ad93-024e1007bffe/ienz_a_250567_f0005_b.gif)