3,150
Views
18
CrossRef citations to date
0
Altmetric
Research Article

New tryptophanase inhibitors: Towards prevention of bacterial biofilm formation

, , , , &
Pages 350-355 | Received 25 Dec 2007, Accepted 05 Mar 2008, Published online: 20 Oct 2008

Figures & data

Scheme 1.  The enzymatic reaction of Tnase with tryptophan results in pyruvate, ammonia and indole production [Citation8].

Scheme 1.  The enzymatic reaction of Tnase with tryptophan results in pyruvate, ammonia and indole production [Citation8].

Scheme 2.  The α,β-elimination reaction of SOPC results in the production of o-nitrothiophenolate, pyruvate and ammonia.

Scheme 2.  The α,β-elimination reaction of SOPC results in the production of o-nitrothiophenolate, pyruvate and ammonia.

Figure 1.  Michaelis-Menten plot of Tnase with S-phenyl-benzoquinone tryptophan. SOPC at different concentrations was used as a substrate, as described in the experimental section. Analyses were done with Calidagraph version 4. Measurements were performed in the absence, ○, and the presence of the inhibitor at a concentration of 47.5 μM, ◊; 95 μM, ▪; 190 μM, X.
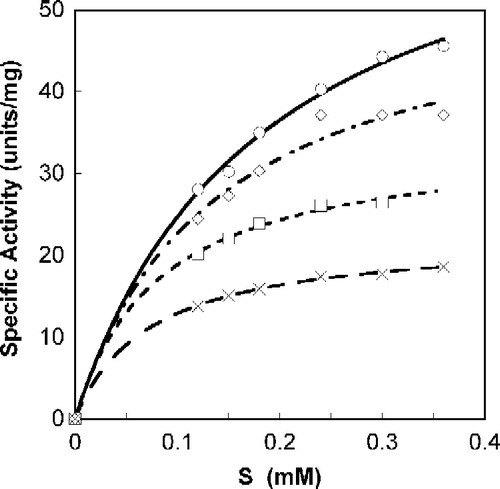
Figure 1.  Michaelis-Menten plot of Tnase with S-phenyl-benzoquinone tryptophan. SOPC at different concentrations was used as a substrate, as described in the experimental section. Analyses were done with Calidagraph version 4. Measurements were performed in the absence, ○, and the presence of the inhibitor at a concentration of 47.5 μM, ◊; 95 μM, ▪; 190 μM, X.

Table I.  Kinetics parameters of the Tnase inhibitors.

Figure 2.  Michaelis-Menten plot of Tnase with N-acetyl-tryptophan. SOPC was used as a substrate at different concentrations. Measurements were performed in the absence, ○, and the presence of the inhibitor at a concentration of 15.5 μM, ◊; 31 μM, ▪; 62 μM, X.
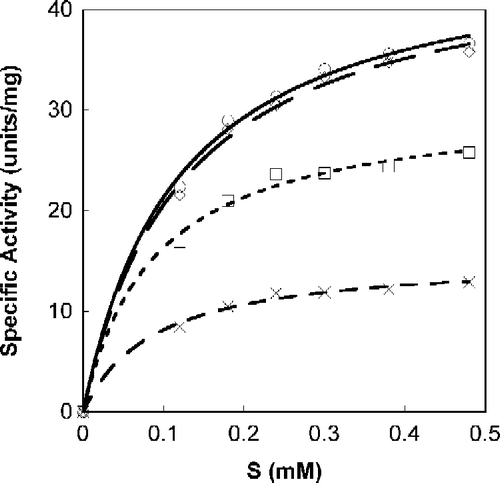
Figure 2.  Michaelis-Menten plot of Tnase with N-acetyl-tryptophan. SOPC was used as a substrate at different concentrations. Measurements were performed in the absence, ○, and the presence of the inhibitor at a concentration of 15.5 μM, ◊; 31 μM, ▪; 62 μM, X.

Figure 3.  Michaelis-Menten plot of Tnase with p-Toluene sulfonic acid salt of L-tryptophan-ethylester. SOPC was used as a substrate at different concentrations. Measurements were performed in the absence, ○, and the presence of the inhibitor at a concentration of 26 μM, ◊; 52 μM, ▪.
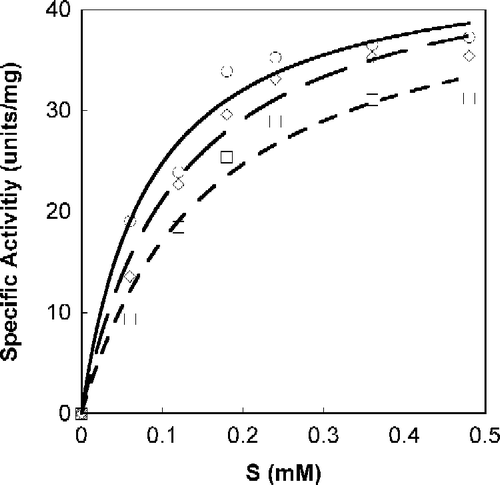
Figure 3.  Michaelis-Menten plot of Tnase with p-Toluene sulfonic acid salt of L-tryptophan-ethylester. SOPC was used as a substrate at different concentrations. Measurements were performed in the absence, ○, and the presence of the inhibitor at a concentration of 26 μM, ◊; 52 μM, ▪.

Figure 4.  Michaelis-Menten plot of Tnase with α-Amino-2-(9,10-anthraquinone)-propanoic acid. SOPC was used as a substrate at different concentrations. Measurements were performed in the absence, ○, and the presence of the inhibitor at a concentration of 55 μM, ◊; 110 μM, ▪; 220 μM, X.
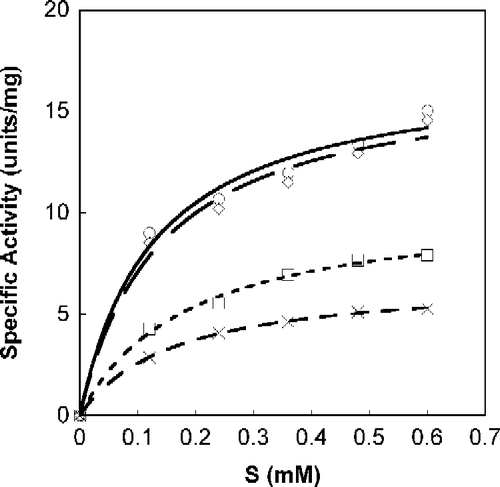
Figure 4.  Michaelis-Menten plot of Tnase with α-Amino-2-(9,10-anthraquinone)-propanoic acid. SOPC was used as a substrate at different concentrations. Measurements were performed in the absence, ○, and the presence of the inhibitor at a concentration of 55 μM, ◊; 110 μM, ▪; 220 μM, X.

Scheme 3.  The mechanism of catalysis of Tnase as proposed by Snell & Mari [Citation21].

Scheme 3.  The mechanism of catalysis of Tnase as proposed by Snell & Mari [Citation21].

Reprints and Corporate Permissions

Please note: Selecting permissions does not provide access to the full text of the article, please see our help page How do I view content?

To request a reprint or corporate permissions for this article, please click on the relevant link below:

Academic Permissions

Please note: Selecting permissions does not provide access to the full text of the article, please see our help page How do I view content?

Obtain permissions instantly via Rightslink by clicking on the button below:

If you are unable to obtain permissions via Rightslink, please complete and submit this Permissions form. For more information, please visit our Permissions help page.