2,853
Views
156
CrossRef citations to date
0
Altmetric
Research Article

Taking advantage of tumor cell adaptations to hypoxia for developing new tumor markers and treatment strategies

, , , , , , , , , , , , , , , , , , , & show all
Pages 1-39 | Received 15 Dec 2008, Accepted 31 Jan 2009, Published online: 01 Apr 2009

Figures & data

Figure 1. Sensing cell culture flask (SCCF). A sensor chip, comprising oxygen and optional pH and NO sensors, is integrated in a standard cell culture flask.
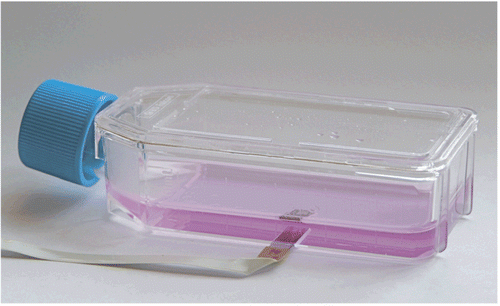
Figure 1.  Sensing cell culture flask (SCCF). A sensor chip, comprising oxygen and optional pH and NO sensors, is integrated in a standard cell culture flask.

Figure 2. Micrograph of the sensing tip of a flexible oxygen sensor array indicating the mean distance of the individual 200 μm diameter oxygen sensors from the cells.
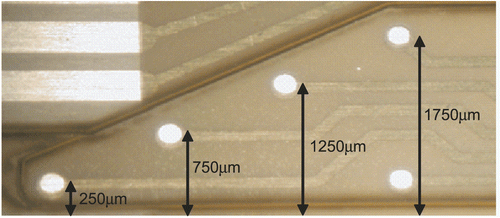
Figure 2.  Micrograph of the sensing tip of a flexible oxygen sensor array indicating the mean distance of the individual 200 μm diameter oxygen sensors from the cells.

Figure 3. Elements involved in alternative splicing of pre-mRNA. Exons are indicated as boxes, introns as thin lines. The 5’ splice-site (CAGguaagu) and 3’ splice-site cagG, as well as the branch point (ynyurac) and polypyrimidine tract (yyyyy), are indicated (y: c or u, n: a, g, c, or u, r: a or g). Upper case letters refer to nucleotides that remain in the mature mRNA.

Figure 3.  Elements involved in alternative splicing of pre-mRNA. Exons are indicated as boxes, introns as thin lines. The 5’ splice-site (CAGguaagu) and 3’ splice-site cagG, as well as the branch point (ynyurac) and polypyrimidine tract (yyyyy), are indicated (y: c or u, n: a, g, c, or u, r: a or g). Upper case letters refer to nucleotides that remain in the mature mRNA.

Figure 4. pH regulation in hypoxic tumor cells. Hypoxia triggers a metabolic shift to glycolysis via HIF-induced up-regulation of glucose transporters (mainly GLUT1) and glycolytic enzymes. Glycolysis produces an excess of lactate and protons that have to be exported out of the cell to prevent intracellular acidification that is incompatible with cell growth and survival. This extrusion is executed by the monocarboxylate transporter (MCT1 and 4) and the Na+/H+ exchanger (NHE1), both transcriptionally regulated by HIF. Acidic catabolites are accumulated in the extracellular microenvironment and cause extracellular acidosis that supports invasion. However, oncogenic metabolism also produces a high amount of CO2 that diffuses through the plasma membrane and contributes to extracellular acidosis. Hypoxia-induced transmembrane carbonic anhydrase CA IX (and CA XII) catalyze a CO2 conversion to bicarbonate ions and protons. Bicarbonate ions are taken by bicarbonate transporters (BTs) and imported to intracellular space where they contribute to neutralization of intracellular pH. Protons remain outside of the cell and further acidify the microenvironment.
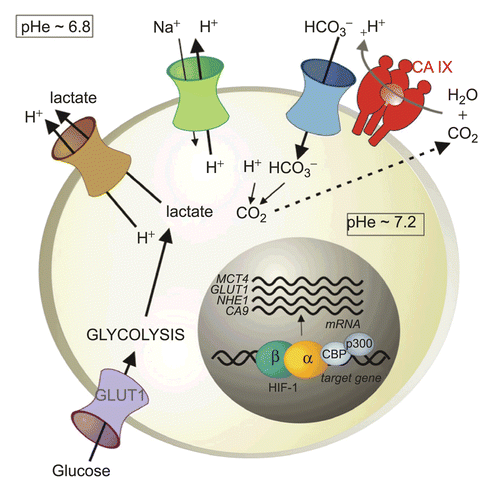
Figure 4.  pH regulation in hypoxic tumor cells. Hypoxia triggers a metabolic shift to glycolysis via HIF-induced up-regulation of glucose transporters (mainly GLUT1) and glycolytic enzymes. Glycolysis produces an excess of lactate and protons that have to be exported out of the cell to prevent intracellular acidification that is incompatible with cell growth and survival. This extrusion is executed by the monocarboxylate transporter (MCT1 and 4) and the Na+/H+ exchanger (NHE1), both transcriptionally regulated by HIF. Acidic catabolites are accumulated in the extracellular microenvironment and cause extracellular acidosis that supports invasion. However, oncogenic metabolism also produces a high amount of CO2 that diffuses through the plasma membrane and contributes to extracellular acidosis. Hypoxia-induced transmembrane carbonic anhydrase CA IX (and CA XII) catalyze a CO2 conversion to bicarbonate ions and protons. Bicarbonate ions are taken by bicarbonate transporters (BTs) and imported to intracellular space where they contribute to neutralization of intracellular pH. Protons remain outside of the cell and further acidify the microenvironment.

Figure 5. Gene array heatmap for hypoxia-regulated genes in head and neck ranked by degree of CA IX expression from left to right. The further to the right a tumor is, the greater is the degree of coordinated up-regulation of the profile. Note that every patient is different and no one marker is expressed in all hypoxic cases.
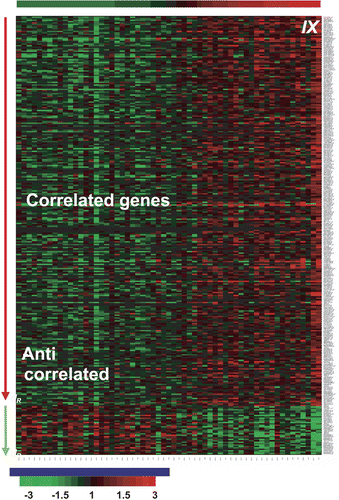
Figure 5.  Gene array heatmap for hypoxia-regulated genes in head and neck ranked by degree of CA IX expression from left to right. The further to the right a tumor is, the greater is the degree of coordinated up-regulation of the profile. Note that every patient is different and no one marker is expressed in all hypoxic cases.

Table 1. Gene list for hypoxia-clustered genes.

Figure 6. Cox multivariate analysis-derived hazard ratios (HRs) with 95% confidence intervals (CIs). Variables used in the original publication of an independent HNSCC patient dataset were entered in the model along with HS-up. HS-up was entered as a continuous variable (fractional rank varying from 0 to 1), and the HR reported represents the risk for an increasing HS-up quartile (the HR for the two ends of the spectrum was 14.83; 95% CI 1.80−122.35).
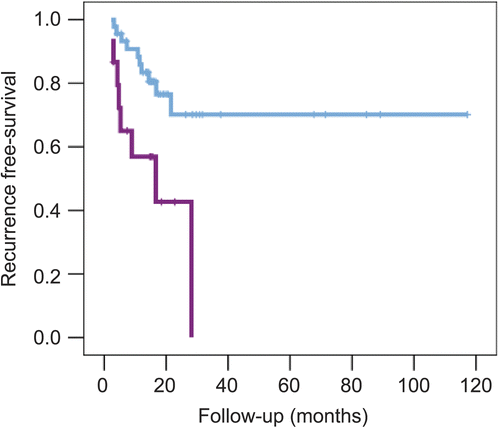
Figure 6.  Cox multivariate analysis-derived hazard ratios (HRs) with 95% confidence intervals (CIs). Variables used in the original publication of an independent HNSCC patient dataset were entered in the model along with HS-up. HS-up was entered as a continuous variable (fractional rank varying from 0 to 1), and the HR reported represents the risk for an increasing HS-up quartile (the HR for the two ends of the spectrum was 14.83; 95% CI 1.80−122.35).

Figure 7. Kaplan–Meier plots of metastasis-free survival in 295 patients with breast cancer. The data were taken from reference 249. (A) Stratified according to HS-up quartiles. The numbers of events and patients for increasing quartiles were 12/73, 18/73, 20/74, and 38/73. (B) Stratified by highest HS-up quartile (0.75−1) vs. the remaining three quartiles (0−0.75). The numbers of events and patients for the two arms were 50/220 and 38/73, respectively.
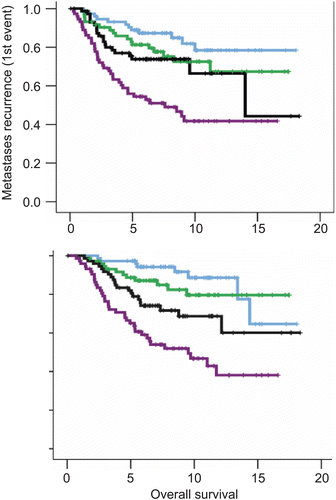
Figure 7.  Kaplan–Meier plots of metastasis-free survival in 295 patients with breast cancer. The data were taken from reference 249. (A) Stratified according to HS-up quartiles. The numbers of events and patients for increasing quartiles were 12/73, 18/73, 20/74, and 38/73. (B) Stratified by highest HS-up quartile (0.75−1) vs. the remaining three quartiles (0−0.75). The numbers of events and patients for the two arms were 50/220 and 38/73, respectively.

Figure 8. Chemical structure of CA IX-selective sulfonamides: fluorescein-thioureido-homosulfanilamide. (Reprinted with permission of Elsevier.)
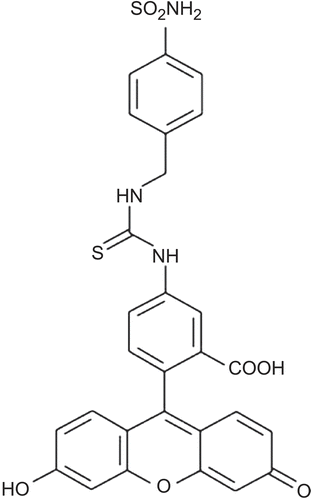
Figure 8.  Chemical structure of CA IX-selective sulfonamides: fluorescein-thioureido-homosulfanilamide. (Reprinted with permission of Elsevier.)

Figure 9. (Adapted from reference 125.) (A) Fluorescence analysis of HeLa cells treated with CAI during normoxia, hypoxia exposure, or upon reoxygenation. (B) Quantitative fluorescence activated cell sorting (FACS) analysis of CAI binding to HeLa cells treated with CAI under the respective conditions. (C) Immunofluorescence analysis of HeLa cells treated with CAI during hypoxia or upon reoxygenation (green). The presence of CA IX was assessed using the monoclonal CA IX (M75) antibody (red). Co-localization of CAI sulfonamide and CA IX monoclonal antibody was assessed by merging the images (yellow). Significant differences are indicated by asterisks (*p < 0.001; **p < 0.01). Scale bars are 25 μm. (Reprinted with permission of Elsevier.)
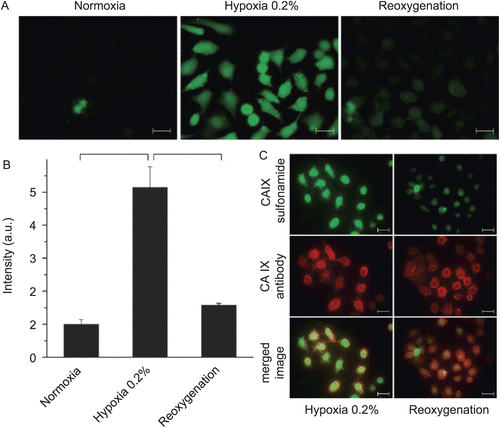
Figure 9.  (Adapted from reference 125.) (A) Fluorescence analysis of HeLa cells treated with CAI during normoxia, hypoxia exposure, or upon reoxygenation. (B) Quantitative fluorescence activated cell sorting (FACS) analysis of CAI binding to HeLa cells treated with CAI under the respective conditions. (C) Immunofluorescence analysis of HeLa cells treated with CAI during hypoxia or upon reoxygenation (green). The presence of CA IX was assessed using the monoclonal CA IX (M75) antibody (red). Co-localization of CAI sulfonamide and CA IX monoclonal antibody was assessed by merging the images (yellow). Significant differences are indicated by asterisks (*p < 0.001; **p < 0.01). Scale bars are 25 μm. (Reprinted with permission of Elsevier.)

Figure 10. Domain organization of the CA IX proteinCitation350. SP, signal peptide; PG, proteoglycan-like domain (residues 42–130); CA, catalytic, carbonic anhydrase domain (residues 167–405); TM, transmembrane segment; IC, intracellular tail.

Figure 10.  Domain organization of the CA IX proteinCitation350. SP, signal peptide; PG, proteoglycan-like domain (residues 42–130); CA, catalytic, carbonic anhydrase domain (residues 167–405); TM, transmembrane segment; IC, intracellular tail.

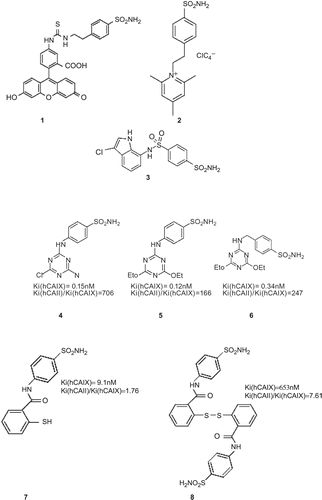
Figure 11. Structures of anti-carbonic anhydrase IX (CA IX) derivatives.

Figure 11.  Structures of anti-carbonic anhydrase IX (CA IX) derivatives.

Table 2. Kinetic parameters for CO2 hydration reaction catalyzed by the 13 vertebrate catalytically active α-CA isozymes, at 20°C and pH 7.5, and their subcellular localizationCitation293.

Reprints and Corporate Permissions

Please note: Selecting permissions does not provide access to the full text of the article, please see our help page How do I view content?

To request a reprint or corporate permissions for this article, please click on the relevant link below:

Academic Permissions

Please note: Selecting permissions does not provide access to the full text of the article, please see our help page How do I view content?

Obtain permissions instantly via Rightslink by clicking on the button below:

If you are unable to obtain permissions via Rightslink, please complete and submit this Permissions form. For more information, please visit our Permissions help page.