Figures & data
Table 1. Baseline clinical characteristics of the subjects enrolled in this study.
Figure 1. Representative Coomassie G250 Blue-stained 2-D-gel pattern of a human liver biopsy homogenate from subject with (A) and without (B) obesity.
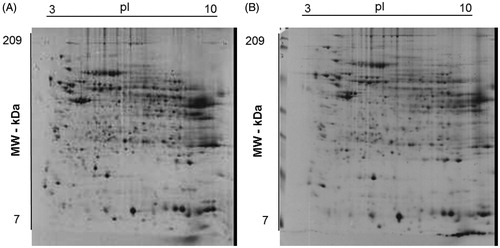
Figure 2. Master gel from 2-DE experiments on liver extracts of human subjects with and without obesity. The resulting 12-bit images were automatically analyzed using PDQuest software based on the spots identified across the gels of liver extract from seven patients with obesity and three without obesity. First dimension, IEF pH 3 to 10 NL (left to right); second dimension, SDS-containing 12% T polyacrylamide gel electrophoresis. Spot numbering corresponds to that reported in . The spots from 1 to 25 indicate a different quantitative representation with respect to control. Spots from 26 to 64 that were common to all compared samples and did not show significant differences.
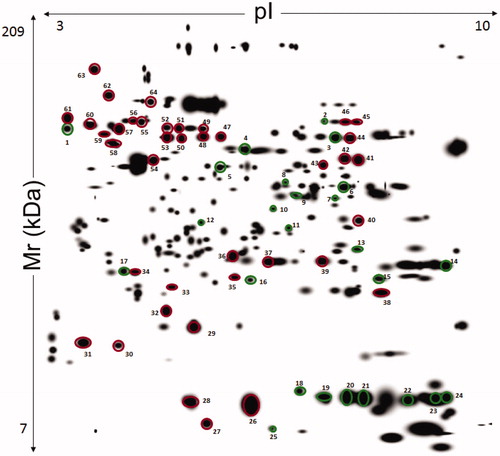
Table 2. Mass spectrometry-based identification of proteins identified in the liver proteomes of obese (O) and nonobese (NO) subjects.
Table 3. Proteins identified as over- and down-represented in the liver of O subjects, compared to control (NO subjects).
Figure 3. Gene Ontology (GO) annotation of identified proteins. The graphs show the percentages of corresponding GO terms to the 25 differentially represented components. The identified proteins were clustered according to three different criteria: cellular component, biological process, and molecular function.
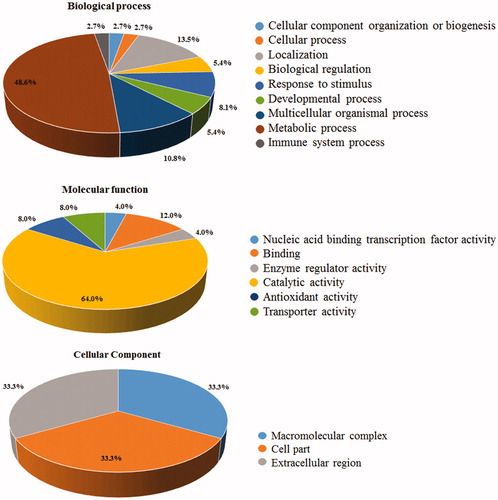
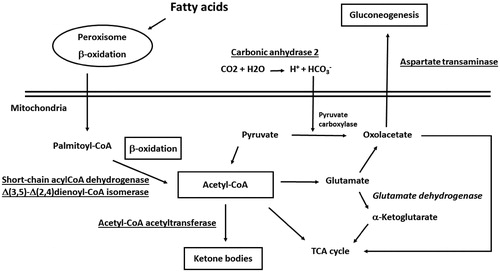
Figure 4. Enzymes involved in fatty acid β-oxidation, ketogenesis, pyruvate metabolism and gluconeogenesis and acetyl-CoA generation/consumption deregulated process in human subjects with obesity. Over-represented proteins and promoted biological processes were underlined; down-represented proteins and reduced biological processes were in italics.