Figures & data
Scheme 1. Synthesis of pyrazolo[3,4-d][1–3]triazin-4-ones 4a–g.
![Scheme 1. Synthesis of pyrazolo[3,4-d][1–3]triazin-4-ones 4a–g.](/cms/asset/3e89f857-ac8b-4602-a012-c85369b74fc9/ienz_a_1530223_sch0001_b.jpg)
Figure 1. Superimposition of the crystal structure of Alsterpaullone ligand in complex with GSK-3, 1Q3W (blue) and the best pose resulting from docking studies (grey).
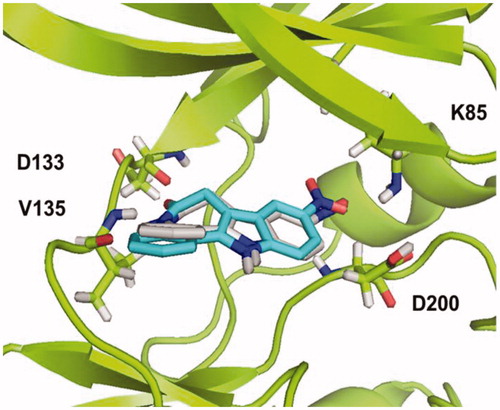
Figure 2. Binding mode for inactive compound 4a (a) and 4e (b) in GSK-3 showing two relevant H-bonds with nearby residues Asp133 and Val135 and negative interaction with Arg141, due to steric impediment.
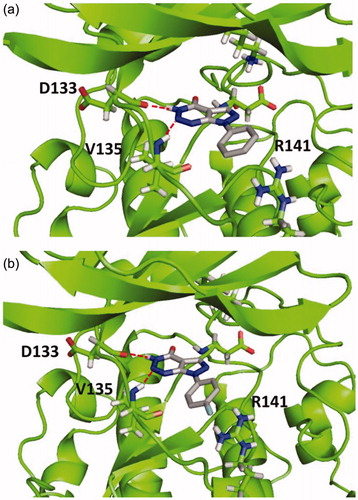
Figure 3. (a) Hotspot analysis of the binding site of the enzyme. (b) Polar regions in the protein cavity that could act as H-bond donor (blue) or H-bond acceptor (red).
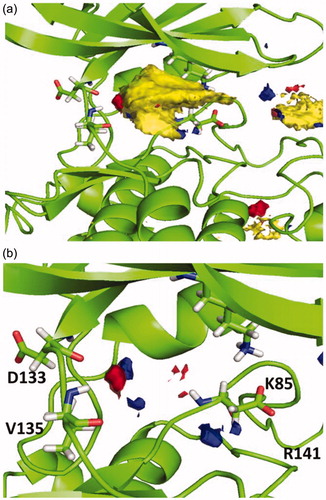
Figure 4. New design scaffold for potential GSK-3 inhibition.
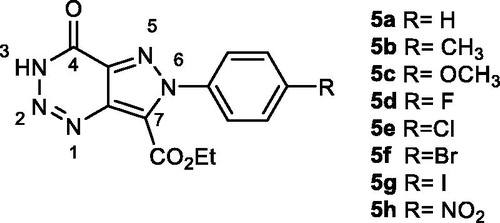
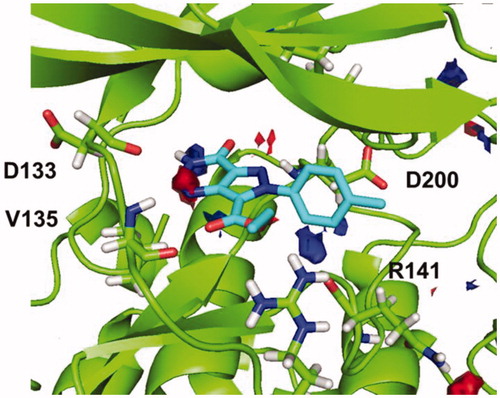
Figure 5. Binding mode for compound 5b (R=CH3) in GSK-3 showing three relevant H-bonds with nearby residues.
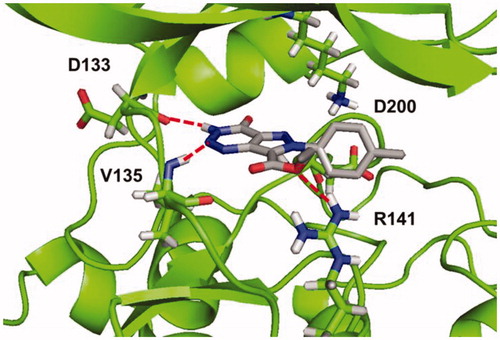
Figure 6. Superimposition of binding mode for compound 5b (R=CH3) with polar regions predicted by the hotspot analysis in GSK-3 cavity.
Scheme 2. Synthesis of hydrazones 7a–h and pyrazoles 8a–h, precursor of the pyrazolotriazinones 5, previously designed. (i) aq. NaNO2 [1.0 mmol], HCl [13.4 mmol] , 0 °C, 30 min; (ii) CH2(CN)2 [1.5 mmol], NaOAc.3H2O [31.0 mmol], H2O [8.5 ml], 0 °C, 2 h; (iii) Br-CH2-CO2Et [2.7 mmol], K2CO3 [1.0 mmol], DMF [3 ml], 90 °C, 5–7 h; (iv) NaNO3 [1.8 mmol], HCl:AcOH 3:1 [20 ml], 0–5 °C to r.t., 20 h.
![Scheme 2. Synthesis of hydrazones 7a–h and pyrazoles 8a–h, precursor of the pyrazolotriazinones 5, previously designed. (i) aq. NaNO2 [1.0 mmol], HCl [13.4 mmol] , 0 °C, 30 min; (ii) CH2(CN)2 [1.5 mmol], NaOAc.3H2O [31.0 mmol], H2O [8.5 ml], 0 °C, 2 h; (iii) Br-CH2-CO2Et [2.7 mmol], K2CO3 [1.0 mmol], DMF [3 ml], 90 °C, 5–7 h; (iv) NaNO3 [1.8 mmol], HCl:AcOH 3:1 [20 ml], 0–5 °C to r.t., 20 h.](/cms/asset/f636a527-b411-4a01-8848-b6b96f8a09d2/ienz_a_1530223_sch0002_b.jpg)
Table 1. Synthesis of hydrazones 7a–h, pyrazoles 8a–h and pyrazolotriazinones 5a–c, e–g.
Figure 7. HMBC and 13C assignation of carbons (in ppm) and correlations for compound 5b.
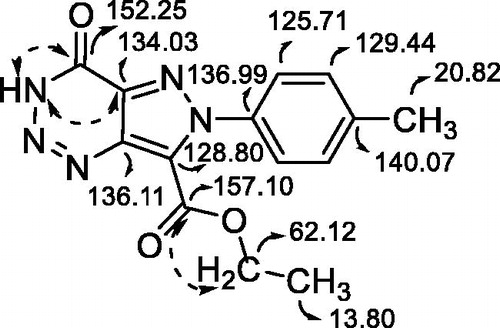
Table 2. Biological inhibition of GSK-3 of ethyl 4-oxo-pyrazolo[4,3-d][1,2,3]triazine-7-carboxylates 5.
Figure 8. Kinetic data determined for 5b suggesting an ATP-competitive behaviour.
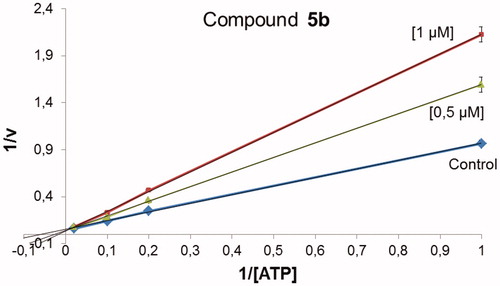
Table 3. Permeability (Pe 10−6 cm s−1) in the PAMPA-BBB assay for 10 commercial drugs (used in the experiment validation) and ethyl pyrazolo[4,3-d][1,2,3]triazine-7-carboxylates with their predictive penetration in the CNS.
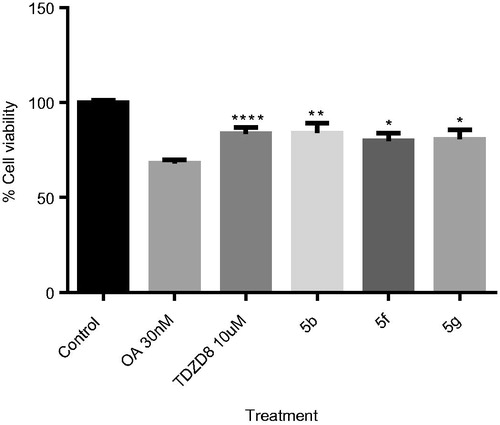
Figure 9. OA-induced neurodegeneration cell model. Effects of treatment with 5b, 5f and 5e. SH-SY5Y cells were treated with the GSK-3 inhibitors at 10 µM for 1 h and subsequently with OA (30 nM). The % of cell viability was measured by the MTT test. Results Mean ± SEM of three experiments, *p < .01, **p < .001, ***p < .0001, ****p < .00001.