Figures & data
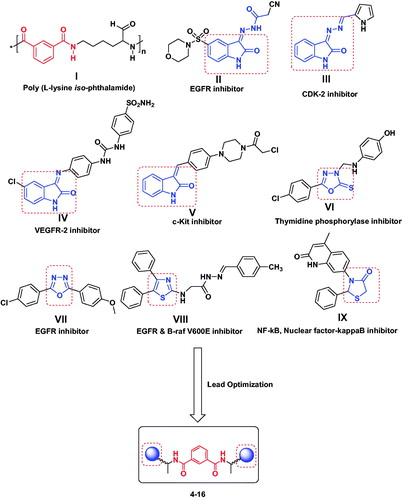
Figure 1. Design of newly synthesized isophthalamide based derivatives 4–16 concerning the chemical structures of poly (l-lysine isophthalamide) (I) and different heterocyclic motifs II–IX with various mechanisms of anticancer activity.
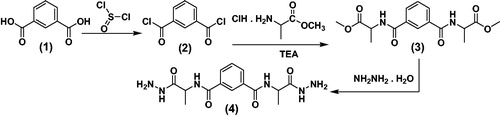
Scheme 1. Synthetic routes for N1,N3-bis-(1-hydrazinyl-1-oxopropan-2-yl) isophthalamide (4).
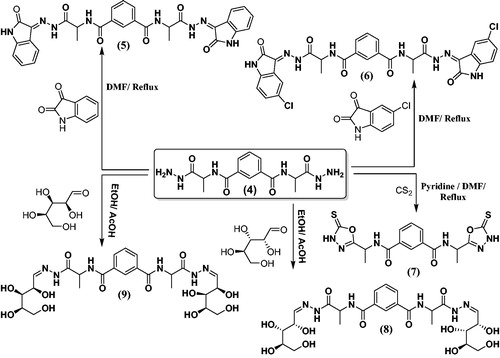
Scheme 2. Synthetic routes for N1,N3- bis-(1-hydrazinyl-1-oxopropan-2-yl) isophthalamide derivatives 5–9.
Scheme 3. Synthetic routes for N1,N3-bis-(1-hydrazinyl-1-oxopropan-2-yl) isophthalamide derivatives 10–16.
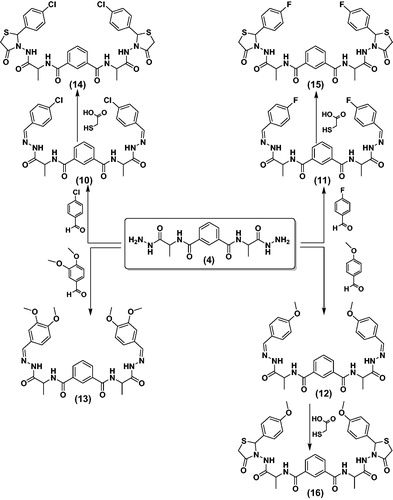
Figure 2. In vitro cytotoxicity of compounds 4–16, against human colon tumour (HCT-116), lung tumor (A-549) and human breast tumour (MCF-7) cell lines at concentration 100 µM. Each result is a mean of 3 replicate and values are represented as % inhibition (± standard error).
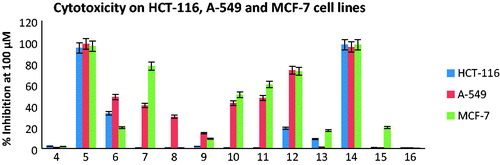
Table 1. IC50 values (concentration required to diminish 50% of the cell) of active compounds possessing ≥ 70% cytotoxicity on colon carcinoma (HCT-116), lung carcinoma (A-549) and breast carcinoma (MCF-7) cell lines.
Figure 3. cytotoxic percentage upon normal skin human cell line (BJ-1) at concentration 100 µM of those compounds gave ≥ 70% cytotoxicity over the three tumour cell lines. Each result is a mean of 3 replicate and values are represented as % inhibition (± standard error).
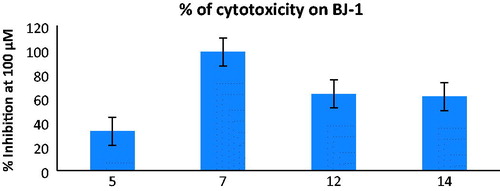
Table 2. Inhibitory evaluation of compound 5 against EGFR, VEGFR-2, CDK-2 and c-Kit kinases.
Figure 4. quantitative analysis of Bax, BCL-2 and Bax/BCL-2 ratio and p53 for compound 5 compared to doxorubicin, where Y-axis represents the protein levels (ng/ml).
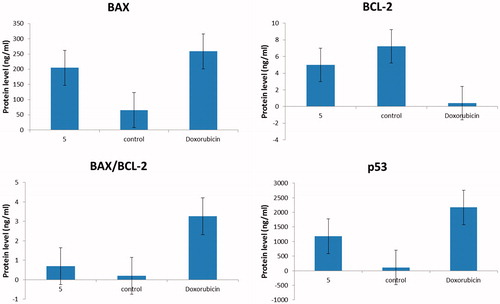
Figure 5. Graphical representation for Caspase-7 concentration (ng/ml) in treated breast cancer cells with compound 5 and untreated compared to doxorubicin and for % DNA fragmentation and IC50 (ng/ml) on tubuline B in comparison with colchicine.
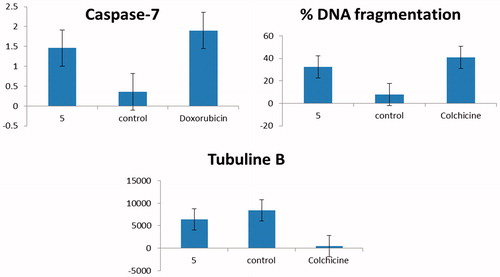
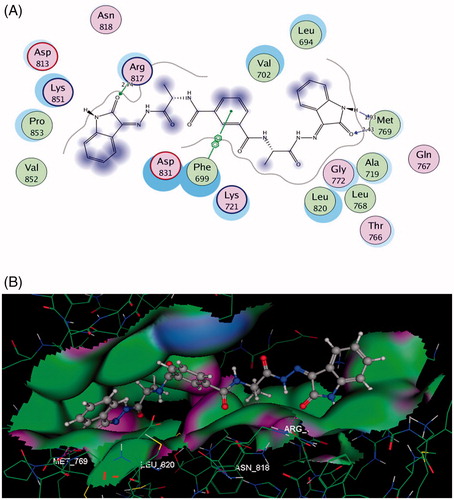
Figure 6. (A and B) Images display 2D and 3D graphs of compound 5 docked into EGFR binding sit (PDB code: 1M17). Green colour indicates hydrophobic area, pink colour indicates high polar area, blue colour indicates mild polar area and dotted lines and arrows represent hydrogen bonds.