Figures & data
Chart 1. Structures of clinically used CAIs.
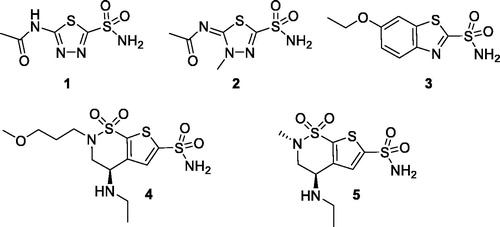
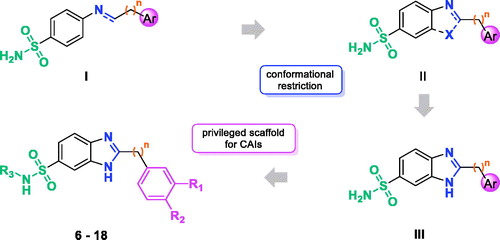
Figure 1. Flowchart of our frozen analog approach.
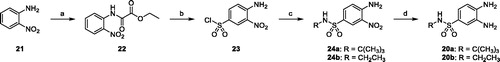
Scheme 1. (a) Ethyl chlorooxoacetate, Et2O, r.t. 18 h (98%); (b) ClSO3H, 80 °C, 3 h (77%); c) tert-butylamine or 2M THF solution of ethylamine, THF, 0 °C to r.t., 18 h (80%); (d) ammonium formate, Pd/C 10%, MeOH, reflux, 4 h (88–94%).
Scheme 2. (a) NaHSO3, dry DMF, 80 °C, 18 h (65%–83%); (b) DCM/TFA (1:1), r.t., 18–24 h (70–75%); (c) LiOH, THF/H2O (1:1) r.t, 3 h (83–93%); (d) EDC hydrochloride, HOBt, NMM, dry DMF, r.t., 18 h (64–90%); (e) p-toluenesulfonic acid, toluene, reflux, 6 h (60–65%); (f) MW, AcOH, 80 °C, 30 min (74%).
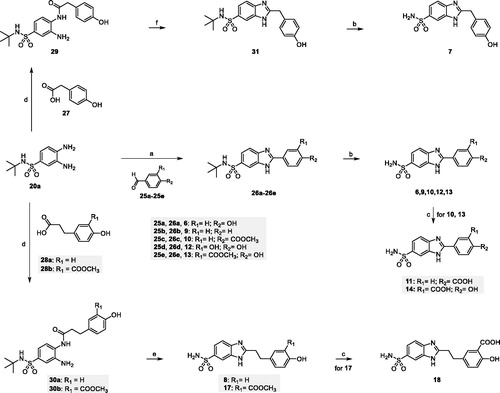
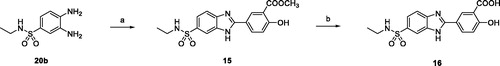
Scheme 3. (a) 25e, NaHSO3, dry DMF, 80 °C, 18 h (71%); (b) LiOH, THF/H2O (1:1) r.t, 3 h (89%).
Scheme 4. (a) SOCl2, reflux, 2 h, then tert-butylamine, NEt3, THF, 0 °C to r.t., 18 h (84%); (b) ammonium formate, Pd/C 10%, MeOH, reflux, 2 h (94%); (c) 25e, NaHSO3, dry DMF, 80 °C, 18 h (72%); (d) DCM/TFA (1:1), r.t. 24 h, then LiOH, THF/H2O (1:1) r.t.,4 h (91%).
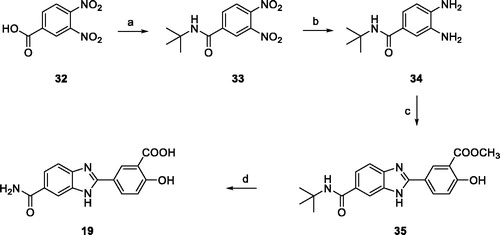
Table 1. Inhibition data of human CA I, II, IX, and XII isoforms with compounds 6–19 and the standard sulfonamide inhibitor AAZ (1) by a stopped-flow CO2 hydrase assay.
Figure 2. (a) 13/hCA IX (PDB 5FL4) theoretical complex as calculated by docking simulations. The protein is shown as cyan ribbons and sticks while the ligand as salmon sticks. Critical residues are labeled. H-bonds are depicted as red dashed lines while coordination bonds as green dashed lines. (b) 13 hCA IX theoretical binding pose within the hCA XII (PDB 5MSA) X-ray structureCitation29. The protein is shown as light blue ribbons and sticks while the ligand as salmon sticks. Critical residues are labeled. H-bonds are depicted as red dashed lines while coordination bonds as green dashed lines. (c) 13 hCA IX theoretical binding pose within the hCA I (PDB 6F3B) structure. The protein is shown as green ribbons and its molecular surface in transparent gray. The ligand is represented as salmon sticks. (d) 13 hCA IX theoretical binding pose within the hCA II (PDB 3K34) structure. The protein is shown as pink ribbons and its molecular surface in transparent gray. The ligand is represented as salmon sticks. The images were rendered using the UCSF Chimera softwareCitation30.
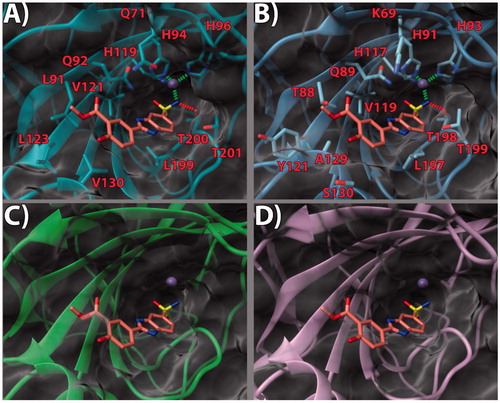
Figure 3. (a) 14/hCA IX (PDB 5FL4) theoretical complex as calculated by docking simulations. The protein is shown as cyan ribbons and sticks while the ligand as orange sticks. Critical residues are labeled. H-bonds are depicted as red dashed lines while coordination bonds as green dashed lines. (b) 14 hCA IX theoretical binding pose within the hCA XII (PDB 5MSA) X-ray structure. The protein is shown as light blue ribbons and sticks while the ligand as orange sticks. Critical residues are labeled. H-bonds are depicted as red dashed lines while coordination bonds as green dashed lines. (c) 14 hCA IX theoretical binding pose within the hCA I (PDB 6F3B) X-ray structure. The protein is shown as green ribbons and its molecular surface as transparent gray. The ligand is shown as orange sticks. (d) 14 hCA IX docked binding pose within the hCA II (PDB 3K34) structure. The protein is shown as pink ribbons and its molecular surface in transparent gray. The ligand is depicted as orange sticks. The images were rendered using the UCSF Chimera softwareCitation30.
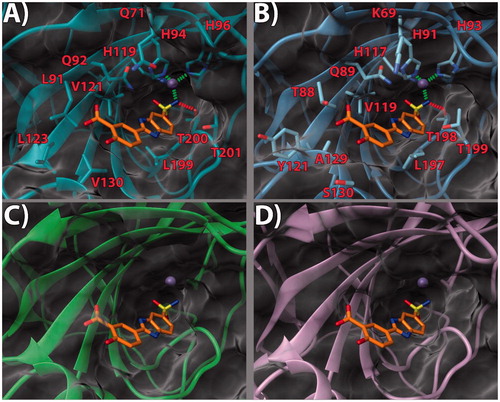
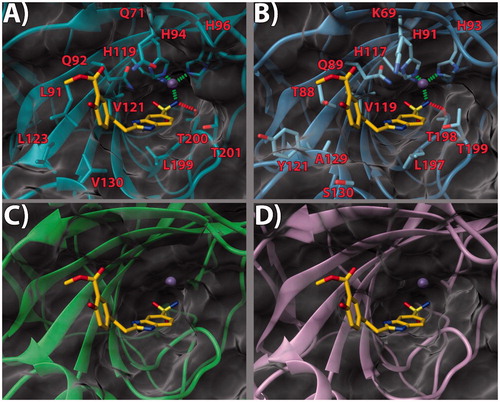
Figure 4. (a) 17/hCA IX (PDB 5FL4) theoretical complex as calculated by docking simulations. The protein is shown as cyan ribbons and sticks while the ligand as yellow sticks. Critical residues are labeled. H-bonds are depicted as red dashed lines while coordination bonds as green dashed lines. (b) 17 hCA IX theoretical binding pose within the hCA XII (PDB 5MSA) X-ray structure. The protein is shown as light blue ribbons and sticks while the ligand as yellow sticks. Critical residues are labeled. H-bonds are depicted as red dashed lines while coordination bonds as green dashed lines. (c) 17 hCA IX theoretical binding pose within the hCA I (PDB 6F3B) X-ray structure. The protein is shown as green ribbons and its molecular surface as transparent gray. The ligand is shown as yellow sticks. (d) 17 hCA IX docked binding pose within the hCA II (PDB 3K34) structure. The protein is shown as pink ribbons and its molecular surface in transparent gray. The ligand is depicted as yellow sticks. The images were rendered using the UCSF Chimera softwareCitation30.