Figures & data
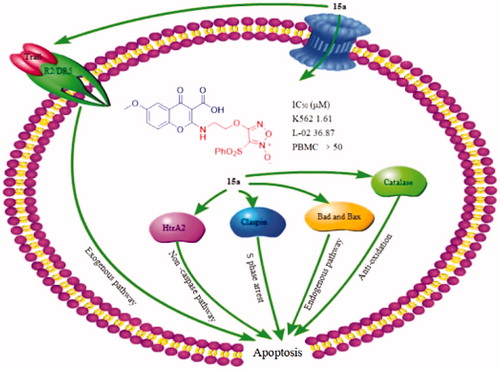
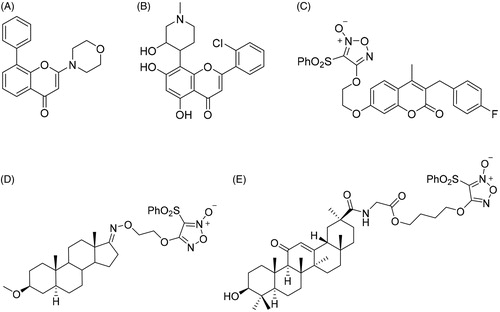
Figure 1. The chemical structures of reported chromone and furoxan derivatives. (A,B) Chromone derivatives; (C–E) furoxan-based NO donor derivatives.
Scheme 1. Synthesis of 5a–d, 12a–d, 13a–d, 14a–b and 15a–b. Reagents and conditions: (I) ClCH2COOH, NaOH (aq), reflux, 2 h; (II) 30% H2O2, AcOH, rt, 3 h; (III) fuming HNO3, 90 °C, 4 h; (IV) aminoalcohol, THF, NaH, 0 °C, 4 h; (V) POCl3, DMF, −10 °C, 15 h; (VI) H3NSO3, NaClO2, 0 °C, 12 h; (VII) 5a–d, HOBt, EDCI, DMF, rt, 3 h.
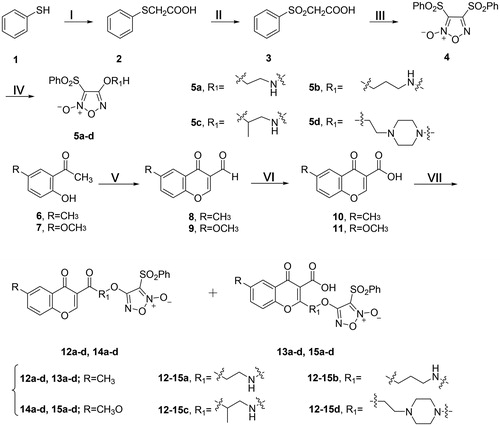
Table 1. The antiproliferative effects of the target compounds against different human cancer and normal cell lines.
Figure 2. The amounts of NO released by the target compounds 12a–d, 13a–d, 14a–d, and 15a–d.
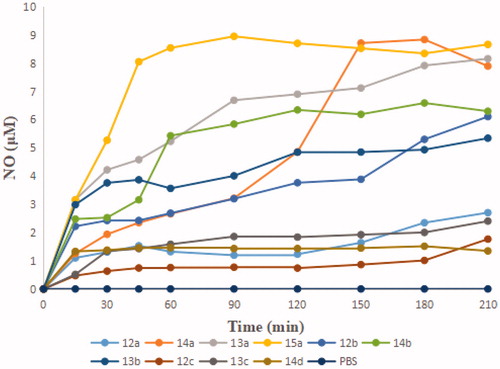
Figure 3. HPLC of (A) 11 and 15a in MeOH; (B) 15a in cell-free culture medium (cRPMI-1640) after incubation for 1, 3, 6, and 12 h.
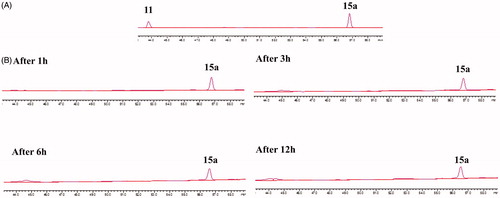
Figure 4. Cell cycle analysis of 15a (0, 0.8, 1.6, and 3.2 μM) in K562 cells, cells were stained with PI and then cell cycle distribution was analysed by flow cytometry.
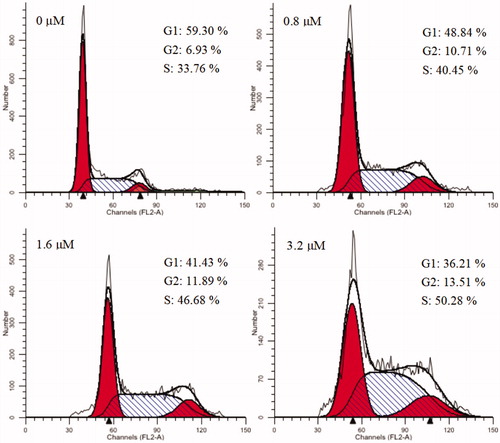
Figure 5. Hoechst staining of 15a-treated K562 cells. The red arrows point to the cells with obvious morphological changes of apoptosis.
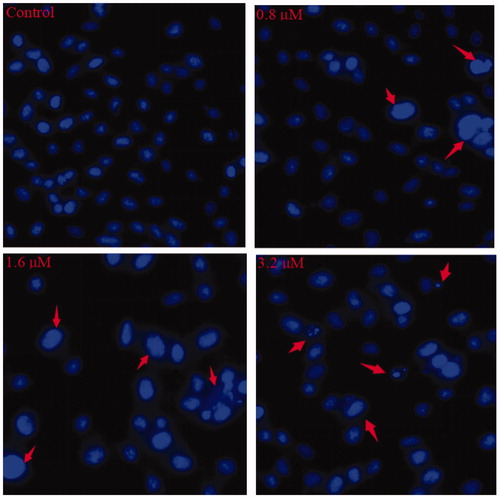
Figure 6. K562 cells were treated with 15a, stained with annexin V-FITC/PI and analysed by flow cytometry.
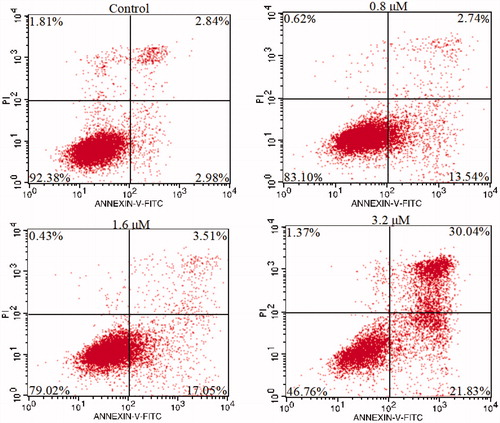
Figure 7. 15a induced mitochondrial depolarisation in K562 cells.
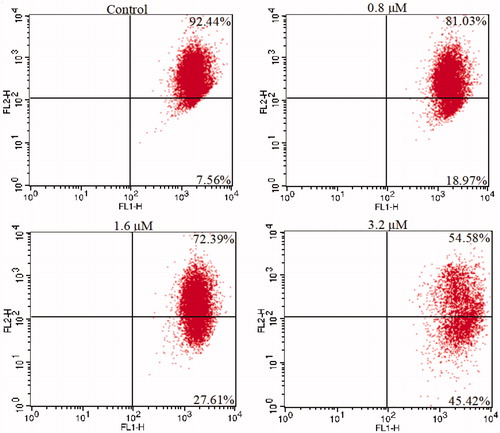
Figure 8. The effects exerted by 15a on the expression of apoptosis-related proteins using the Human Apoptosis Array kit in K562 cells.
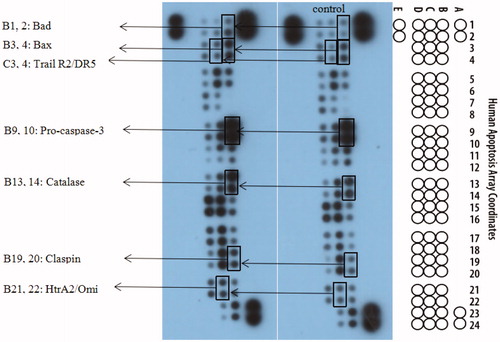
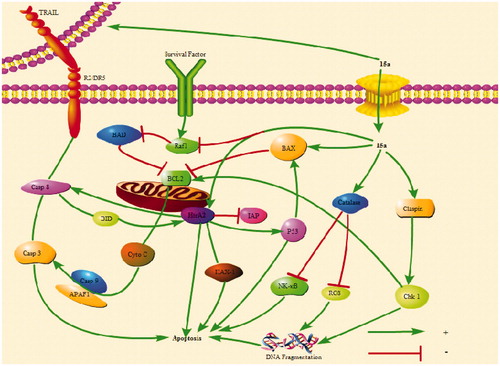
Figure 9. 15a induced K562 cells death through multiple pathways. Bad and Bax participate in endogenous pathways. Trail R2/DR5 induces cell death through exogenous pathways. HtrA2 kills cells through non-caspase pathway. In addition, catalase promotes apoptosis by inhibiting NF-κB translocation and reactive oxygen content. Claspin indirectly induces DNA damage to kill cells.