Figures & data
Figure 1. Active site view of the superimposed hCA II adducts with its main substrates: CO2 (green, pdb 2VVA) and bicarbonate (pink, pdb 2VVB) Citation24. The zinc ion is shown as a grey sphere with its three coordinated protein ligands (green/red), His94, 96 and 119. Amino acid residues involved in the binding of the substrates/inhibitors, at the bottom of the active site, are also shown.
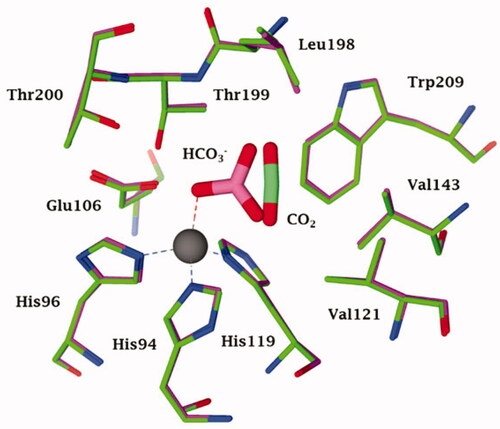
Figure 2. Representation of the superimposed X-ray crystallographic data for hCA II adducts with cyanate (cyan, pdb 4E5QCitation31) bromide (magenta, pdb 1RAZCitation32) azide (blue, pdb 1RAYCitation32) O2 (presumably as superoxide anion or radical anion; red, pdb 5EOICitation33) with a tetrahedrally coordinated active site zinc ion (grey sphere). The key active site zinc ligands (His94, 96 and 119) and “gate-keeping” residues (Thr199, Glu106) are also shown.
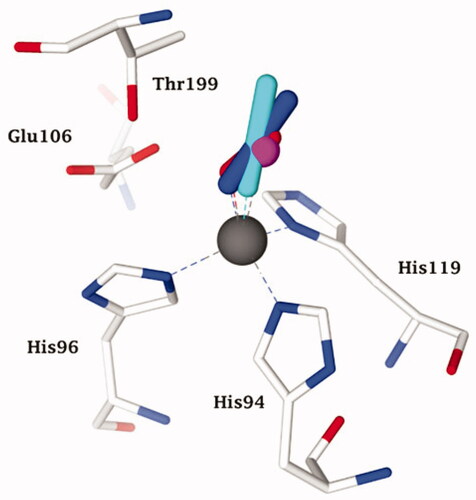
Figure 3. Representation of the superimposed hCA II adducted to cyanate (cyan, pdb 4E5QCitation31) bicarbonate (pink, pdb 2VVBCitation24) urea (as anion) (white, pdb 1BV3 [39]), and trithiocarbonate (light blue, pdb 3K7KCitation40) The zinc ion (grey sphere), its protein ligands (His94, 96 and 119) and gate-keeping residues (Thr199, Glu106) are also shown.
![Figure 3. Representation of the superimposed hCA II adducted to cyanate (cyan, pdb 4E5QCitation31) bicarbonate (pink, pdb 2VVBCitation24) urea (as anion) (white, pdb 1BV3 [39]), and trithiocarbonate (light blue, pdb 3K7KCitation40) The zinc ion (grey sphere), its protein ligands (His94, 96 and 119) and gate-keeping residues (Thr199, Glu106) are also shown.](/cms/asset/6911aa26-9fda-4687-825d-fb54f97c3ed6/ienz_a_1882453_f0003_c.jpg)
Figure 4. Representation of the binding of A) O2− to a Zn2+/Cu2+ hCA II (pdb 5EOICitation33) and B) nitrite to Cu2+ substituted Cu2-hCA II (pdb 6PDVCitation43) Distances of the closest atom of the anion to the metal ion are: Zn-O (in the O2 adduct) of 1.88 Å; Cu-O (nitrite adduct) of 2.14 Å.
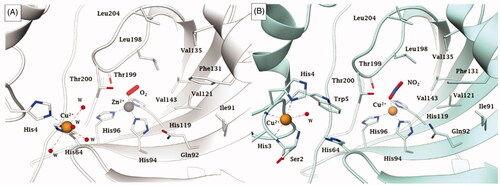
Figure 5. Active site view of A) hCA IX catalytic domain adducted to SLC-0111 (magenta)Citation74 and B) hCA II adducted to the three tailed inhibitor 4 (in green).Citation71 H-bonds are represented as black dashed lines. The Zn(II) ion (grey sphere) and some important amino acid residues involved in the binding of inhibitors are shown.
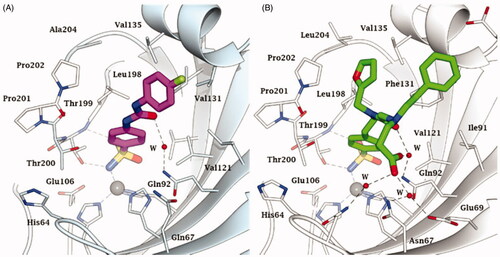
Figure 6. Historical overview on the discovery of the main chemotypes with CA inhibitory activity.
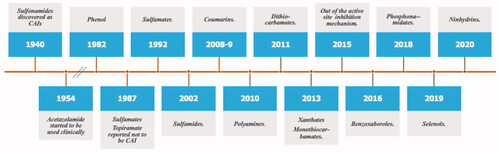
Figure 7. Active site view of hCA II complexed to A) selenol 11 (pdb 6hX5) Citation96, B) ninhydrin 10 (predicted in silico)Citation127 and C) catechol derivative 12 (pdb 6YRI) Citation128. H-bonds are represented as black dashed lines. The Zn(II) ion (grey sphere) and residues involved in its coordination and some active site residues near the binding of inhibitors are shown in CPK colours. Water molecules are shown as red spheres.
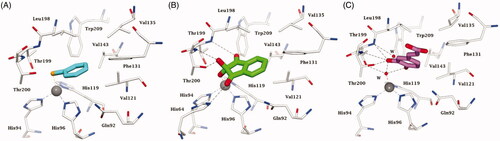
Figure 8. hCAs as drug targetsCitation11,Citation14,Citation51–57. From edoema and glaucoma, to obesity, neuropathic pain, hypoxic cancers, cerebrovascular diseases and oxidative stress, many isoforms are involved in diverse pathologies for which isoform-selective inhibitors showed a relevant potential to be translated to clinical entities.
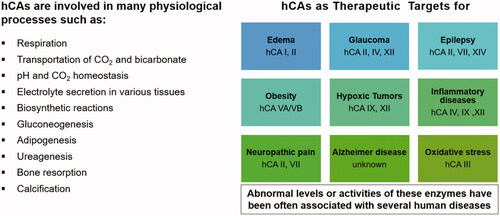
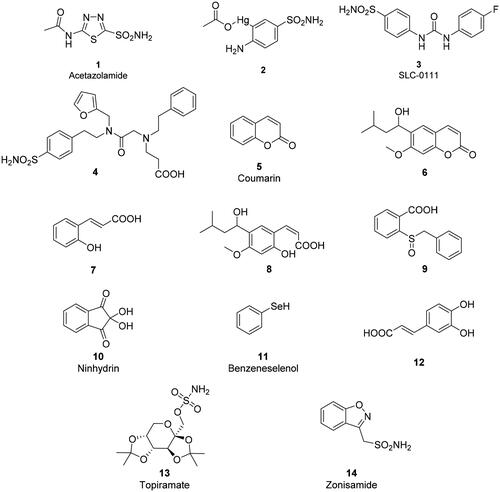
Chart 1. Structure of the compounds 1–14 discussed in this review.