Figures & data
Figure 1. Chemical structure of the investigated CAIs: acetazolamide (ACTZ) and newly reported sulphonamide CAIs.
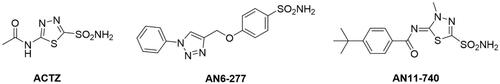
Table 1. Inhibition data of CA isoforms I, II, IX, and XII by inhibitors ACTZ, AN6-277, and AN11-740 by a stopped flow CO2 hydrase assayCitation29.
Figure 2. Effects of different CA inhibitors on AD development during 30 min OGD in the CA1 region. (A–D) The graphs show the d.c. shift traces during 30 min OGD in untreated OGD slices (A, n = 20), in the presence of 20 µM ACTZ (B, n = 5), 3 µM AN11-740 (C, n = 8) and 5 µM AN6-277 (D, n = 7). Each inhibitor was applied at least 20 min before OGD and maintained for all the insult. (E) Each column represents the mean ± SEM of AD latency recorded in hippocampal slices during 30 min OGD in different experimental groups. AD was measured from the beginning of OGD insult. *p < 0.05, **p < 0.01, ***p < 0.001 vs. OGD, One-way ANOVA followed by Bonferroni post hoc test. (F): Each column represents the mean ± SEM of AD amplitude recorded in the CA1 region during 30 min OGD. The number of slices is reported in the columns.
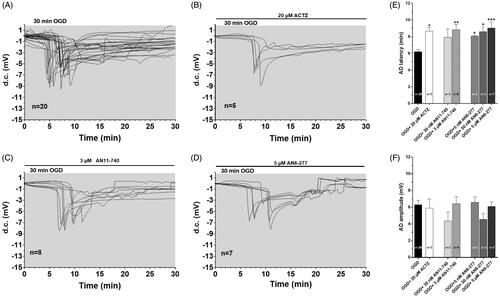
Figure 3. Effect of sub-chronic treatment with ACTZ and AN11-740 on neurological deficit, 24 h after pMCAo. mNSS test: the score is evaluated 24 h after pMCAo in sham-operated (n = 7), vehicle-treated (n = 4), ACTZ-treated (n = 4) and AN11-740-treated (n = 5) rats. Data are expressed as mean ± SEM, one-way ANOVA followed by Newman-Keuls post hoc test: #p < 0.001 sham-operated rats vs. vehicle- ACTZ- AN11-740-treated rats; *at least p < 0.01 ACTZ- and AN11-740-treated rats vs. vehicle-treated rats.
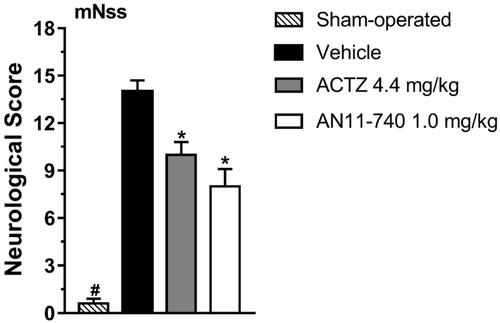
Figure 4. Effect of sub-chronic treatment with ACTZ and AN11-740 on infarct area (A,C) and infarct volume (B,D) in the cortex and striatum 24 h after pMCAo. (A,C) Data represent infarct area measured at 12 predetermined coronal levels through the brain of vehicle-treated (n = 4), ACTZ-treated (n = 4) and AN11-740-treated (n = 5) rats. Bregma = 0 [37]. (B,D) Bar graphs indicate the infarct volume calculated as mean ± SEM in the striatum and cortex. One-way ANOVA followed by Newman–Keuls post hoc test: *p < 0.05 and **p < 0.01 vs. vehicle-treated rats.
![Figure 4. Effect of sub-chronic treatment with ACTZ and AN11-740 on infarct area (A,C) and infarct volume (B,D) in the cortex and striatum 24 h after pMCAo. (A,C) Data represent infarct area measured at 12 predetermined coronal levels through the brain of vehicle-treated (n = 4), ACTZ-treated (n = 4) and AN11-740-treated (n = 5) rats. Bregma = 0 [37]. (B,D) Bar graphs indicate the infarct volume calculated as mean ± SEM in the striatum and cortex. One-way ANOVA followed by Newman–Keuls post hoc test: *p < 0.05 and **p < 0.01 vs. vehicle-treated rats.](/cms/asset/5fe4f25e-2430-496e-8ed2-83ab870b2647/ienz_a_1907575_f0004_b.jpg)
Figure 5. Effect of sub-chronic treatment with ACTZ and AN11-740 on the cytoarchitecture of the striatum and cortex 24 h after pMCAo. Upper part: Representative photomicrograph of a coronal section (at Bregma = 0Citation36,) showing the ischaemic area in a vehicle-treated rat. The two white squares indicate regions within the ischaemic area where photomicrographs were captured. Scale bar = 2 mm. (A–H) Representative microphotographs of H&E staining from dorsal striatum and fronto-parietal cortex of a sham-operated (A,B), a vehicle- (C,D), an ACTZ- (E,F) and an AN11-740-treated rat (G, H). The white matter fascicula (f) are evidenced. Scale bar = 100 µm. (I,J) Quantitative analyses of heterochromatic nuclei per striatal (I) and cortical areas (F) at coronal level AP = 0 from Bregma. Data represent the mean ± SEM of 3 rats/group. One-way ANOVA followed by Newman-Keuls post hoc test: #at least p < 0.05 ACTZ- vs. vehicle-treated rats; *at least p < 0.001 AN11-740- vs. vehicle-treated rats.
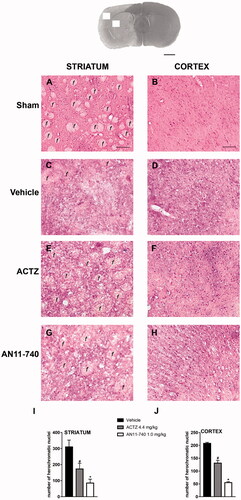
Figure 6. Effect of sub-chronic treatment with ACTZ and AN11-740 on neuronal damage in cortex and striatum 24 h after pMCAo. Upper part: Representative photomicrograph of a coronal section (at Bregma = 0,Citation37) showing the ischaemic area in a vehicle-treated rat. The two white and black squares indicate regions within the ischaemic area and within the perischemic area, respectively, where photomicrographs were captured. Scale bar = 2 mm. (A–P) Representative microphotographs of neurons (red) in cortical ischaemic and perischemic areas and in striatal ischaemic and perischemic areas of sham-operated (A, B; I, J; n = 3), vehicle- (C, D; K, L; n = 4) ACTZ- (E, F; M, N; n = 4) and AN11-740- (G, H; O, P; n = 5) treated rats. Scale bar = 50 µm. (Q, R) Quantitative analysis of NeuN+ cells in cortical and striatal ischaemic and perischemic areas, bar graphs represent mean ± SEM of the number of neurons per optical field (20×). One-way ANOVA followed by Newman–Keuls post hoc test: #at least p < 0.01 vehicle-treated vs. sham-operated rats; *at least p < 0.05 ACTZ- and AN11-740- vs. vehicle-treated rats.
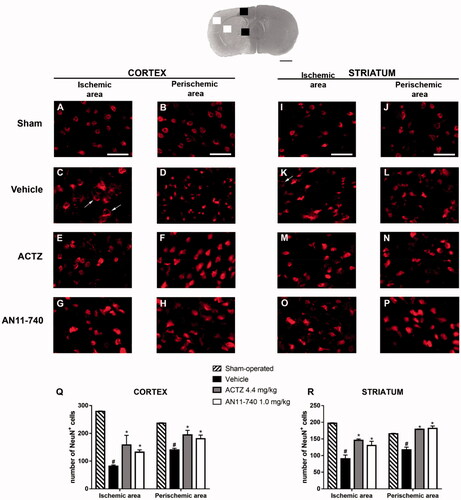
Figure 7. Effect of sub-chronic treatment with ACTZ and AN11-740 on microglia activation in cortex and striatum 24 h after pMCAo. Upper part: Representative photomicrograph of a coronal section (at Bregma = 0Citation36) showing the ischaemic area in a vehicle-treated rat. The two white and black squares indicate regions within the ischaemic area and within the perischemic area, respectively, where photomicrographs were captured. Scale bar = 2 mm. (A–P) Representative microphotographs of microglia (green) in cortical ischaemic and perischemic areas and in striatal ischaemic and perischemic areas of sham-operated (A, B; I, J, n = 3), vehicle- (C, D; K, L, n = 3) ACTZ- (E, F; M, N, n = 4) and AN11-740- (G, H; O, P, n = 3) treated rats. Scale bar = 50 µm. (Q, R) Quantitative analysis of IBA1+ cells in cortical and striatal ischaemic and perischemic areas, bar graphs represent mean ± SEM of the number of microglia cells per optical field (20×). One-way ANOVA followed by Newman–Keuls post hoc test: #at least p < 0.05 vehicle-treated vs. sham-operated rats; *at least p < 0.05 ACTZ- and AN11-740- vs. vehicle-treated rats.
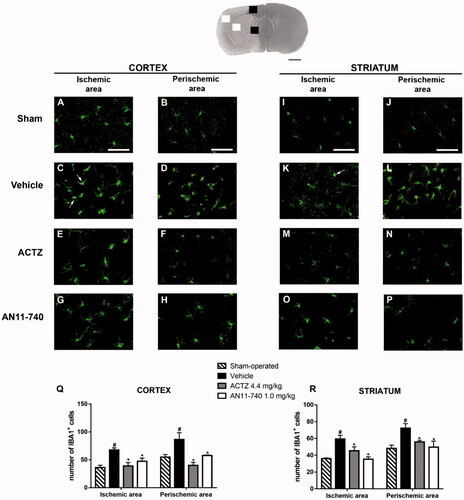
Figure 8. Effect of sub-chronic treatment with ACTZ and AN11-740 on astrocytes alteration in cortex and striatum 24 h after pMCAo. Upper part: Representative photomicrograph of a coronal section (at Bregma = 0Citation36) showing the ischaemic area in a vehicle-treated rat. The two white and black squares indicate regions within the ischaemic area and within the perischemic area, respectively, where photomicrographs were captured. Scale bar = 2 mm. (A–P) representative microphotographs of astrocytes (red) in cortical ischaemic and perischemic areas and in striatal ischaemic and perischemic areas of sham-operated (A, B; I, J, n = 3), vehicle- (C, D; K, L, n = 3) ACTZ- (E, F; M, N, n = 4) and AN11-740- (G, H; O, P, n = 3) treated rats. Scale bar = 50 µm. (Q, R) Quantitative analysis of GFAP+ cells in cortical and striatal ischaemic and perischemic areas, bar graphs represent mean ± SEM of the number of astrocytes per optical field (20×). One-way ANOVA followed by Newman–Keuls post hoc test: #at least p < 0.05 vehicle-treated vs. sham-operated rats; **at least p < 0.01 ACTZ- and AN11-740- vs. vehicle-treated rats.
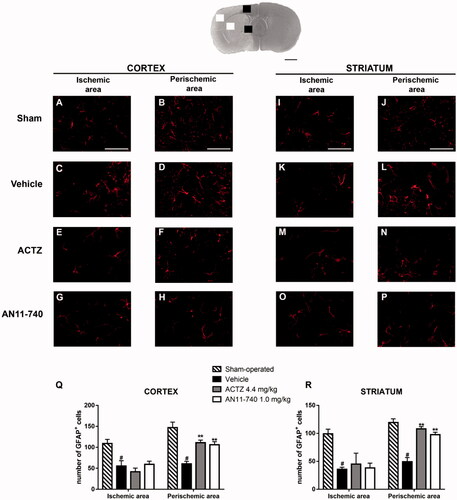
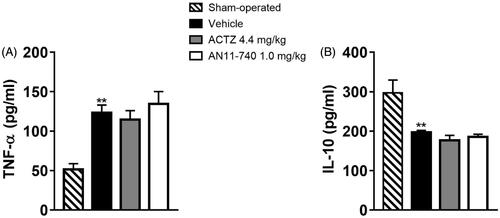
Figure 9. Effect of sub-chronic treatment with ACTZ and AN11-740 on TNF-α (A) and IL-10 (B) plasma levels. Results are expressed as pg of protein/ml of plasma and values are mean ± SEM. One-way ANOVA followed by Newman–Keuls post hoc test: **p < 0.01 vs. sham-operated rats.