Figures & data
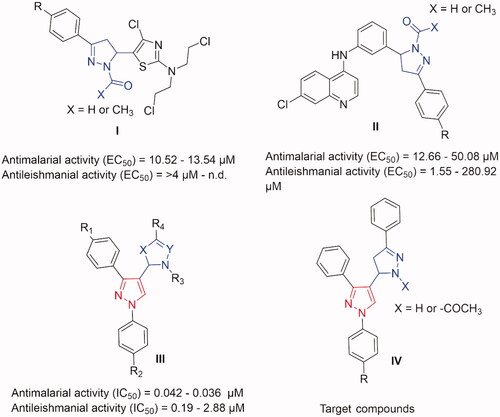
Figure 1. Some previously reported pyrazoline derivatives (I and II) and pyrazole hybrids with other heterocyclic moieties (III) with dual antimalarial and antileishmanial activity. Compounds (IV) represent our target compounds.
Scheme 1. General synthetic route of the target compounds.
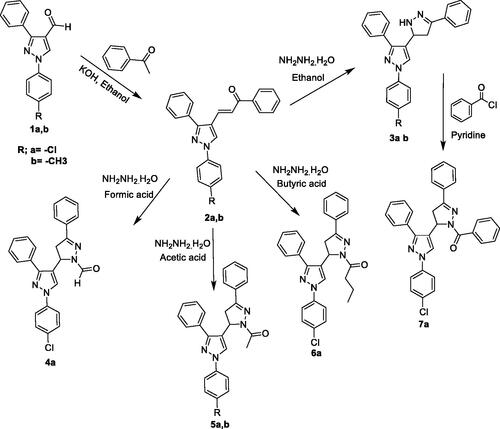
Table 1. Antiplasmodial activities of the synthesised compounds at 20 mg/kg.
Table 2. Antiplasmodial activities of the synthesised compounds at 30 mg/kg.
Table 3. In vitro anti-plasmodial activity against chloroquine-resistant (RKL9) strain of P. falciparum.
Table 4. Antileishmanial activity is expressed as antipromastigote and antiamastigote activities of the test compounds and reference standards.
Table 5. Data from the acute toxicity studies.
Table 6. AutoDock Vina docking scores (kcal mol−1) of the most active compounds against Pf DHFR-TS (PDB: 1j3k) and PTR1 (PDB: 2bfm).
Figure 2. The docking pose of the most active compound (5b) as cyan sticks in the binding site of the quadruple mutant Pf-DHFR-TS (PDB code: 1j3k). The hydrophilic and hydrophobic regions are in red and green coloured molecular surfaces, respectively. Non-polar hydrogen atoms were omitted for clarity. The label “NDP-610” represents the NADPH co-factor.
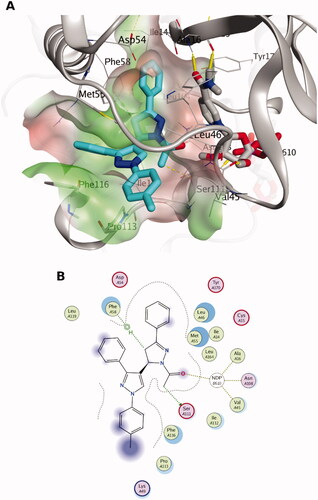
Figure 3. The docking pose of the most active compound (7a) as cyan sticks in the binding site of PTR1 (PDB code: 7pxx). The hydrophilic and hydrophobic regions are in red and green coloured molecular surfaces, respectively. Non-polar hydrogen atoms were omitted for clarity. The label “NDP-302” represents the NADPH co-factor.
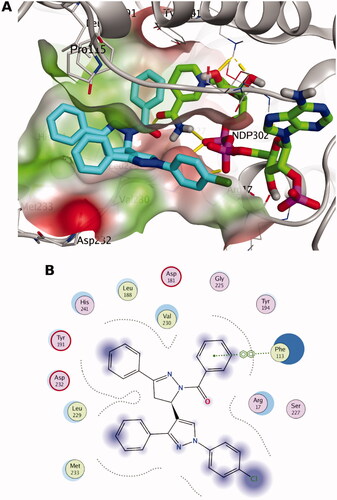
Figure 4. MD simulations for the three systems, the apo leishmanial PTR1, 7a-PTR1 complex and co-crystal ligand – PTR1 complex systems. (A) Root mean square deviation (RMSD) of the protein alpha carbon atoms across the 50 ns simulation. (B) The radius of gyration (Rg) for the PTR1 protein across the 50 ns simulation time. The frame number (x-axis) 5000 indicates 50 ns simulation time. (C) Per residue, root means square fluctuation (RMSF). (D) Hydrogen bond counts during the MD simulation for 7a in the binding site during the 50 ns simulation. (E) RMSD of the ligand heavy atoms during the 50 ns simulation of the ligand-complexed systems.
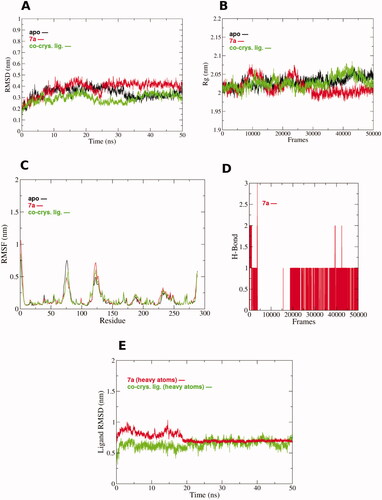
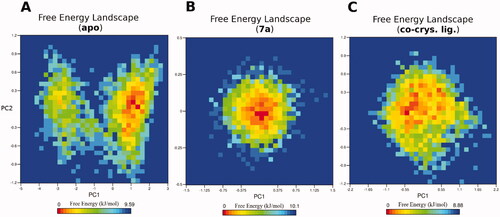
Figure 5. The free energy landscape (FEL) of the simulated PTR1 systems is based on the principal component analysis. (A) Leishmanial PTR1. (B) 7a-PTR1 complex. (C) Co-crystal ligand – PTR1 complex. The colour bar represents the free energy value in kcal mol − 1. The colour ranges from red to yellow to blue spots indicate the energy minima and energetically favoured protein conformations to more unfavourable high-energy conformations.