Figures & data
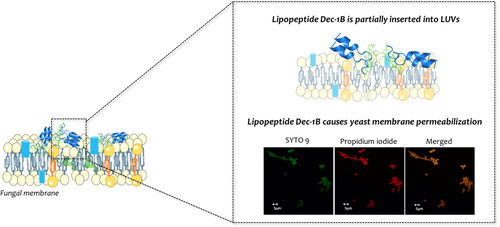
Table 1. Antimycotic-susceptibility profiles of clinical C. albicans used in our study.
Table 2. MIC and MFC values of Pent-1B and Dec-1B against test C. albicans strains.
Figure 1. Representation of peptide sequences of Pent-1B and Dec-1B derived from the lipidation of the peptide 1B.
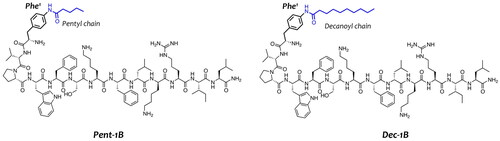
Table 3. Fractional inhibitory concentration (FIC) index values of peptides on selected C. albicans strains.
Figure 2. The cell viability of peptide treated HaCaT cells evaluated by MTT assay at 24 h. Dotted lines indicate 75 of cell viability as “cell viability limit”. Values are presented as means ± SD of 3 independent experiments **p ≤ 0.01; ***p ≤ 0.001 vs. Ctrl group. Statistical analysis performed by one way ANOVA followed by Bonferroni’s for multiple comparisons.
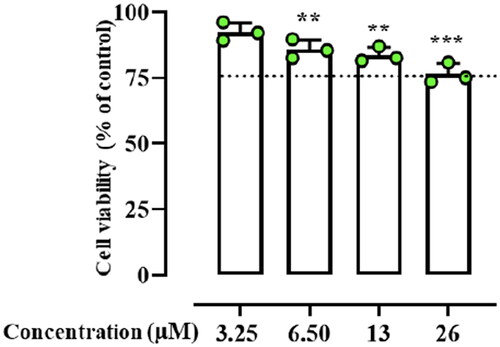
Figure 3. Panel A reports the CAC of the peptide Dec-1B, while the CAC of Pent-1B was already calculated previouslyCitation29. The CAC was obtained plotting wavelength corresponding to the maximum fluorescence emission of Nile red as a function of the concentration of peptide. Panel B reports the peptide aggregation monitored by ThT fluorescence at different peptide concentrations of 5, 10, 20, and 30 µM.
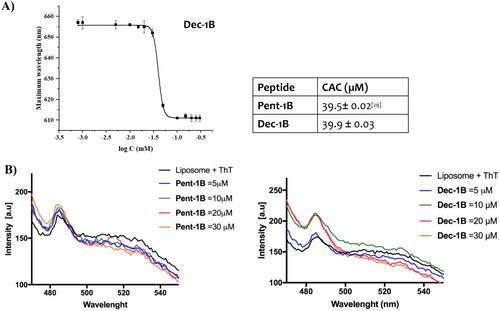
Figure 4. Tryptophan fluorescence spectra for the peptides Pent-1B (panel A) and Dec-1B (panel B) recorded in water (on the left) and in LUVs composed of PE/PC/PI/Ergosterol (5:4:1:2, w/w/w/w) (on the right).
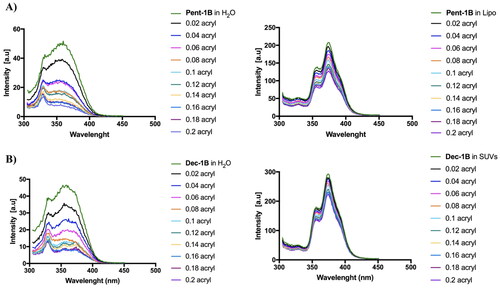
Figure 5. Quenching of tryptophan by acrylamide of peptides Pent-1B and Dec-1B and Stern-Volmer (Ksv) quenching constants of peptides both in water and LUVs mimicking fungal membrane.
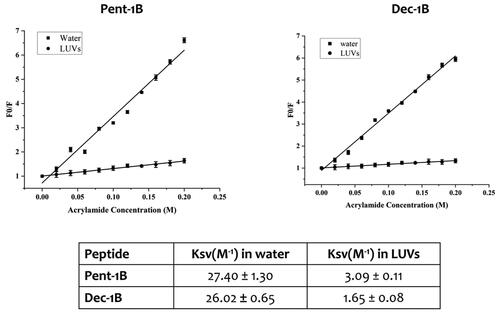
Figure 6. Tryptophan fluorescence spectra for the peptides Pent-1B (panel A) and Dec-1B (panel B) recorded in the presence of the probes 11,12-Br-PC, 9,10-Br-PC, and 6,7-Br-PC.
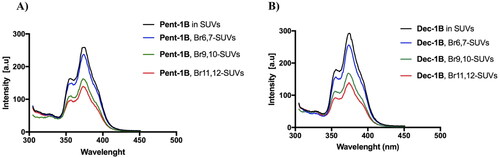
Figure 7. Cartoon representation of the best 15 NMR/CYANA structures of Pent-1B in DPC 20 mM. Side - chains are shown as sticks coloured by amino acid type: gray, hydrophobic; blue, basic; yellow, polar.
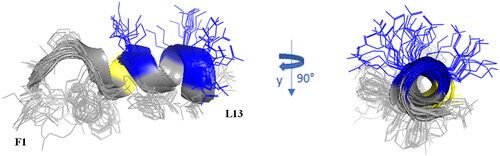
Figure 8. Cartoon representation of the best 15 NMR/CYANA structures of Dec-1B in DPC 40 mM. Side - chains are shown as sticks coloured by amino acid type: gray, hydrophobic; blue, basic; yellow, polar.
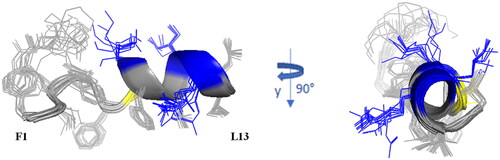
Figure 9. The percentage of signal intensity remaining after the addition of the 16-DSA to Pent-1B in DPC for HN—Hα TOCSY cross peaks.
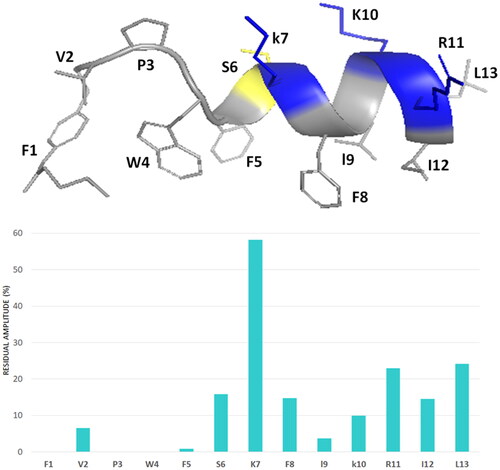
Figure 10. Detection of cell membrane permeabilisation in living C. albicans cells from control culture (A) and cultures treated with Pent-1B (B) or Dec-1B (C) by CLSM. The cells were stained with SYTO9 and Propidium iodide (PI). Fluorescence images of the same samples at 528 nm for SYTO9 (green fluorescence; left panels), 645 nm for PI (red fluorescence; middle panels) and merged images (right panels) are shown. SYTO 9 penetrates both viable and nonviable cells, while PI penetrates only cells with compromised membranes. Candida cells showing yellow-red fluorescence are considered as dead cells.
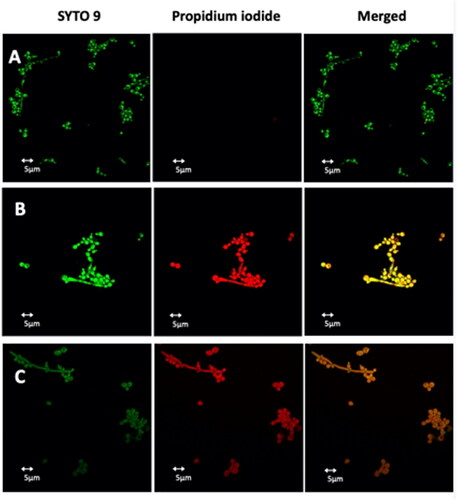
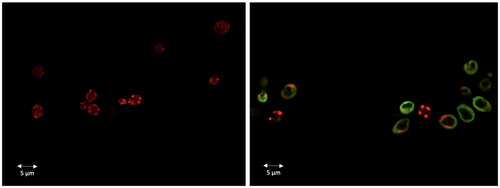
Figure 11. Dec-1B localisation in C. albicans cells detected by CLSM. Dec-1B conjugated with 5(6)-carboxyfluorescein is coloured in green, while the mitochondria are visualised in red by MitoTracker. The images show C. albicans cells before treatment (left panel) and after treatment for 30 min with Dec-1B (right panel) with the green signal localised on the surface.