
Figures & data
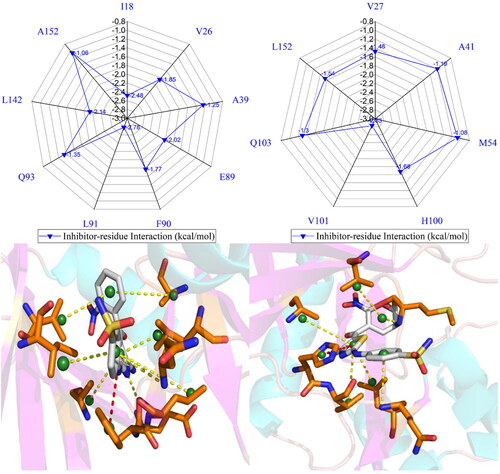
Figure 1. Molecular structures of CDK2/CDK6 and three inhibitors: (A) the structure of cyclin-dependent kinases CDK2 and CDK6 are coloured in cyan and orange, respectively; (B) binding pocket of two different inhibitors to CDK2 and CDK6, among which inhibitors are displayed in stick modes and CDK2 and CDK6 in surface modes; (C–E) separately correspond to the structures of X64, X3A, and 4AU, in which inhibitors are displayed in line modes. In this figure, the crystal structures, PDB code 4GCJ, and 4AUA are applied to respectively represent the structures of the X64-CDK2 and 4AU-CDK6 complexes.

Figure 2. Root-mean-square fluctuations (RMSFs) of the Cα atoms in CDK2 and CDK6: (A) RMSFs for CDK2 complexed with inhibitors X64, X3A, and 4 AU, (B) the structure of CDK2, (C) RMSFs for CDK6 complexed with inhibitors X64, X3A, and 4 AU, (D) the structure of CDK6.

Figure 3. Frequency distribution of the MSAs of the inhibitor-CDK2/CDK6 complexes: (A) the X64-CDK2 and X64-CDK6 complexes; (B) the X3A-CDK2 and X3A-CDK6 complexes; (C) the 4AU-CDK2 and 4 AU-CDK6 complexes.

Figure 4. DCCMs calculated by using the coordinates of the atoms around their mean positions from the SIT: (A), (C), and (E) corresponding to CDK2 complexed with X64, X3A, and 4AU, separately and (B), (D), and (F) corresponding to CDK6 complexed with X64, X3A, and 4AU, respectively.

Figure 5. Free energy landscapes and structural information: (A) and (B) separately corresponding to free energy landscapes of the X64-bound CDK2 and CDK6; (C) and (D), respectively, indicating structural superimpositions of the X64-bound CDK2 and CDK6 situated at different potential wells; (E) and (F) separately indicating structural alignments of X64 in different energy wells. CDK2 and CDK6 are displayed in cartoon and X64 in stick modes.

Figure 6. Free energy landscapes and structural information: (A) and (B) separately corresponding to free energy landscapes of the X3A-bound CDK2 and CDK6; (C) and (D), respectively, indicating structural superimpositions of the X3A-bound CDK2 and CDK6 situated at different energy wells; (E) and (F) separately indicating structural alignments of X3A in different energy wells. CDK2 and CDK6 are displayed in cartoon styles and X3A in stick modes, respectively.

Figure 7. Free energy landscapes and structural information: (A) and (B) separately corresponding to free energy landscapes of the 4AU-bound CDK2 and CDK6; (C) and (D) respectively indicating structural superimpositions of the 4AU-bound CDK2 and CDK6 situated at different energy wells; (E) and (F) separately indicating structural alignments of 4AU at different energy wells. CDK2 and CDK6 and 4AU are displayed in cartoon patterns and 4AU in stick modes, respectively.

Table 1. Binding affinities of inhibitors X64, X3A and 4 AU to CDK2 and CDK6 computed with the MM-GBSA approacha.
Figure 8. Inhibitor-residue interactions computed by using residue-based free energy decomposition method, only residues stronger than 0.9 kcal/mol are listed: (A) the X64-CDK2 complex, (B) the X64-CDK6 complex, (C) the X3A-CDK2 complex, (D) the X3A-CDK6 complex, (E) the 4AU-CDK2 complex and (F) the 4AU-CDK6 complex.

Figure 9. Hydrophobic interactions and frequency distribution of distance involved in interactions of inhibitors with key residues: (A) the X64-CDK2 complex; (B) RDF of X64-CDK2; (C) the X3A-CDK2 complex; (D) RDF of X3A-CDK2; (E) the 4AU-CDK2 complex; (F) RDF of 4AU-CDK2. The frequency of distances between atoms involving significant interactions was calculated by using the integrated MSMD trajectories of the last 900 ns. The yellow dash lines describe the CH–π interactions and the red dash ones indicate the π–π interactions.

Figure 10. Hydrogen bonds and the corresponding radial distribution function (RDF) of H-O distance between three inhibitors and key residues of CDK2: (A) the X64-CDK2 complex; (B) RDF of H-O distance between L91-O and X64-N02-H1, L91-N-H and X64-N01, E89-O and X64-N03-H3, and E89-O and X64-N03-H2; (C) the X3A-CDK2 complex; (D) RDF of H-O distance between L91-O and X3A-N15-H7, L91-N-H and X3A-N1, E89-O and X3A-N3-H1, E89-O and X3A-N3-H2, and N140-ND2-HD22 and X3A-N8; (E) the 4 AU-CDK2 complex and (F) RDF of H-O distances between L91-N-H and 4 AU-O16, E89-O and 4 AU-N7-H5, and L91-O and 4 AU-N9-H6.

Table 2. Hydrogen bonding interactions of inhibitors with CDK2 and CDK6.
Supplemental Material
Download PDF (452.5 KB)Data availability statement
Supporting data are supplied with the manuscript.