Figures & data
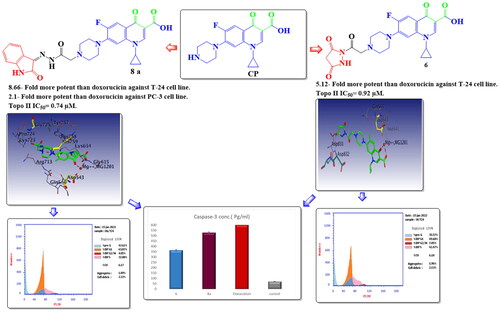
Figure 1. Structures of CP and potent anticancer CP derivatives I–III.
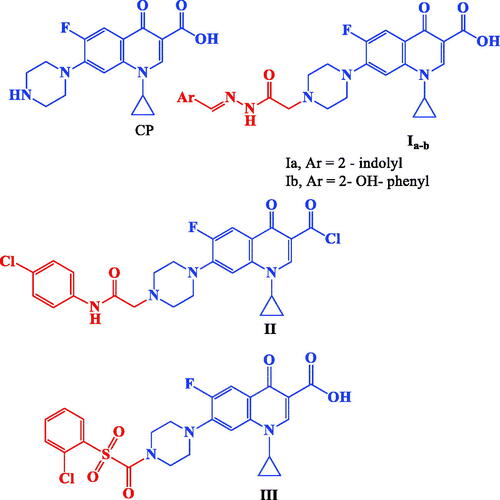
Figure 2. Potent Topo II inhibitors.
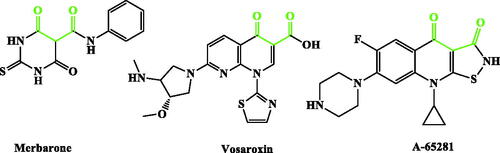
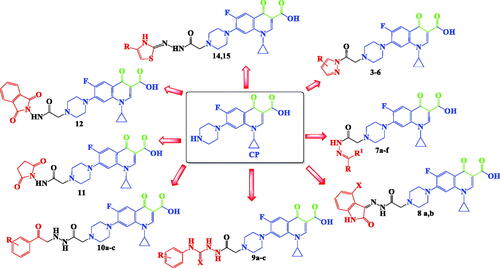
Figure 3. Design strategy for the synthesised CP hybrids.
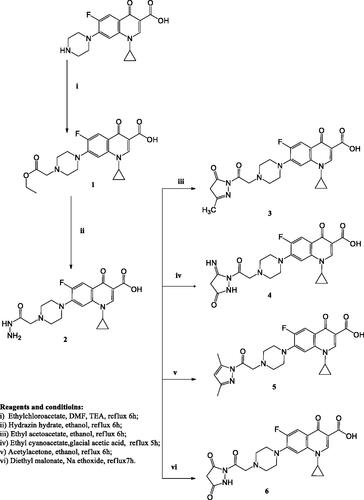
Scheme 1. The synthetic path and reagents for the preparation of the target compounds 1–6.
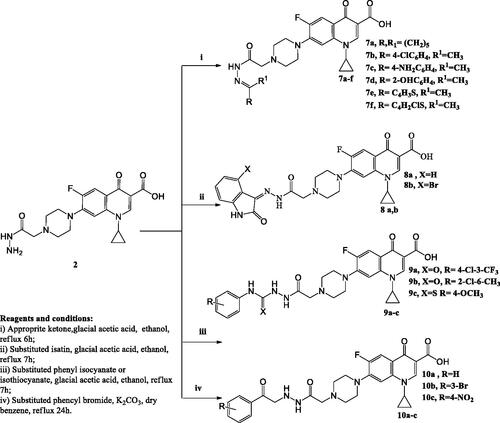
Scheme 2. The synthetic path and reagents for the preparation of the target compounds 7–10.
Scheme 3. The synthetic path and reagents for the preparation of the target compounds 11–15.
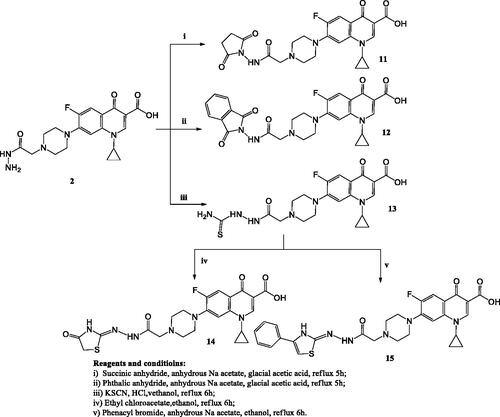
Table 1. The half-maximal inhibitory concentration (IC50) of CP derivatives and doxorubicin after treatment for 24 h on both the prostate cancer cell line (PC-3) and bladder cancer cell line (T-24).
Figure 4. Graphical representation for the half-maximal inhibitory concentration (IC50) of CP derivatives and doxorubicin after treatment for 24 h on bladder cancer cell line.
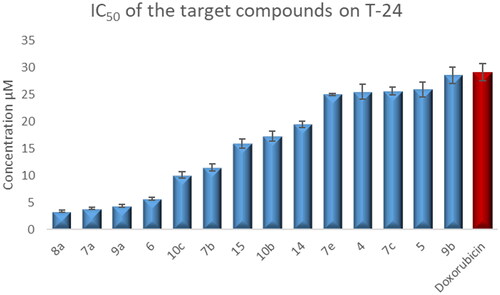
Figure 5. Graphical representation for half-maximal inhibitory concentration (IC50) of the target compounds and doxorubicin after treatment for 24 h on the prostate cancer cell line.
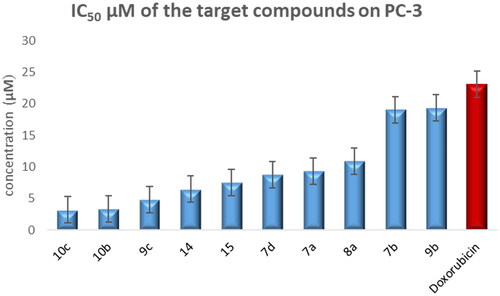
Figure 6. Recombinant Topo II inhibitory activities of compounds 6, 7a, 7b, 8a, 9a, and 10c at 100, 10, 1, 0.1 µM. Lane P: pBR322 DNA only; lane N: pBR322 DNA + Topo II; lanes (6, 7a, 7 b, 8a, 9a and 10c): pBR322 DNA + Topo II + compounds 6, 7a, 7 b, 8a, 9a and 10c.
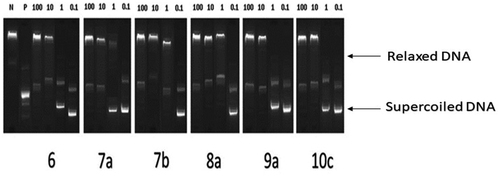
Table 2. Recombinant Topo II inhibitory activities of compounds (6, 7a, 7b, 8a, 9a, and 10c).
Table 3. Topo II IC50 results of compounds (6, 7a, 7b, 8a, 9a, and 10c) compared to doxorubicin.
Figure 7. Effect of compound 6 (5.68 μM) on DNA-ploidy flow cytometric analysis of T-24 cells after 24 h.
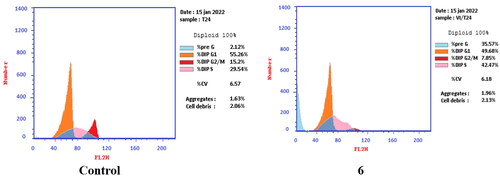
Figure 8. Effect of compound 8a (3.36 μM) on DNA-ploidy flow cytometric analysis of T-24 cells after 24 h.
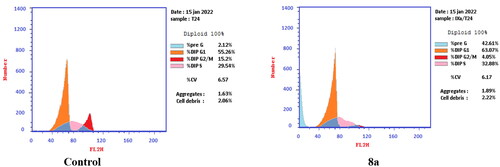
Figure 9. Bar presentation showing effects of compounds 6 (5.68 μM) and 8a (3.36 μM) on DNA-ploidy flow cytometric analysis of T-24 cells after 24 h.
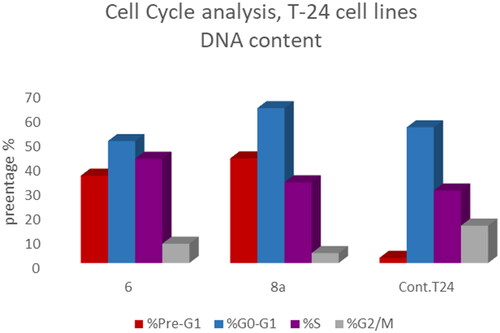
Figure 10. Effect of compound 6 (92.16 μM) on DNA ploidy flow cytometric analysis of PC-3 cells after 24 h.
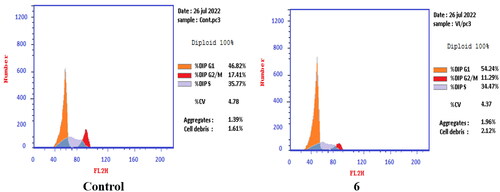
Figure 11. Effect of compound 8a (10.95 μM) on DNA-ploidy flow cytometric analysis of PC-3 cells after 24 h.
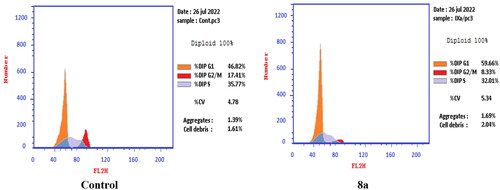
Figure 12. Bar presentation showing effects of compounds 6 (92.16 μM) and 8a (10.95 μM) on DNA-ploidy flow cytometric analysis of PC-3 cells after 24 h.
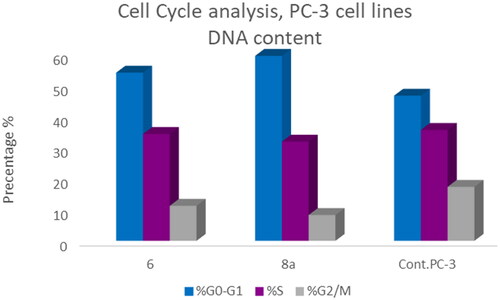
Figure 13. Representative dot plots of T-24 cells treated with 6 (5.68 μM) for 24 h and analysed by flow cytometry after double staining of the cells with annexin-V FITC and PI.
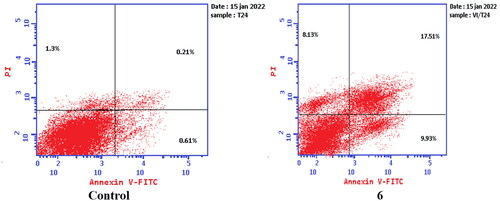
Figure 14. Representative dot plots of T-24 cells treated with 8a (3.36 μM) for 24 h and analysed by flow cytometry after double staining of the cells with annexin-V FITC and PI.
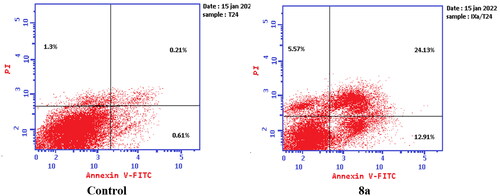
Figure 15. Representative dot plots of PC-3 cells treated with 6 (92.16 μM) for 24 h and analysed by flow cytometry after double staining of the cells with annexin-V FITC and PI.
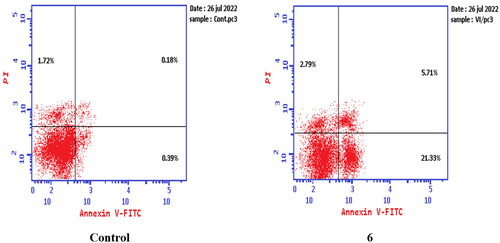
Figure 16. Representative dot plots of PC-3 cells treated with 8a (10.95 μM) for 24 h and analysed by flow cytometry after double staining of the cells with annexin-V FITC and PI.
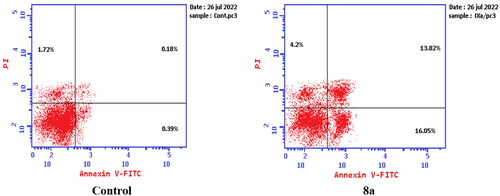
Figure 17. Graphical representation for active caspase-3 assays of compounds 6 and 8a compared to doxorubicin as a positive control.
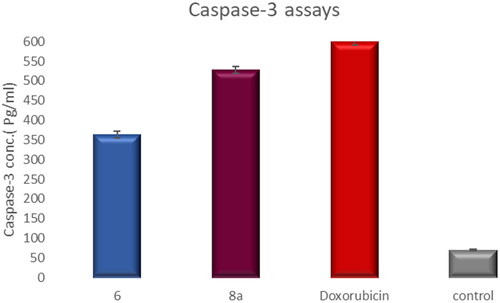
Table 4. Active caspase-3 assay results.
Figure 18. 3D interaction of merbarone with DNA binding site of topoisomerase IIα. Red dashed lines represent coordinate bond interactions with Mg2+. Red tiny, dashed lines are hydrogen bonding interactions with amino acid Asp 543. Mg2+ is shown as a nonbonded sphere (crimson red). Residues that are involved in hydrogen bonding are shown in the stick presentation.
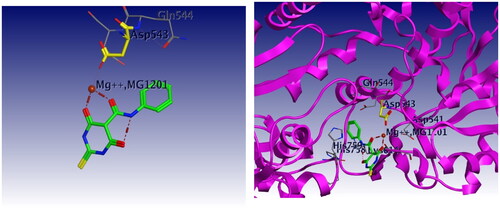
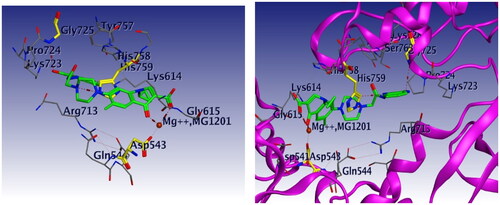
Figure 19. 3D interaction of compound 6 with DNA binding site of topoisomerase IIα. Red dashed lines represent coordinate bond interactions with Mg2+. Red tiny, dashed lines are hydrogen bonding interactions with amino acid Asp 543, and Asp 831. Mg2+ is shown as a nonbonded sphere (crimson red). Residues that are involved in hydrogen bonding are shown in the stick presentation.
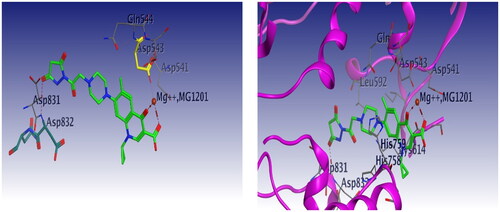
Figure 20. 3D interaction of compound 8a with DNA binding site of topoisomerase IIα. Red dashed lines represent coordinate bond interactions with Mg2+. Red tiny, dashed lines are hydrogen bonding interactions with amino acid Asp 543, acids His 759 and Gly 725. Mg2+ is shown as a nonbonded sphere (crimson red). Residues that are involved in hydrogen bonding are shown in the stick presentation.