Figures & data
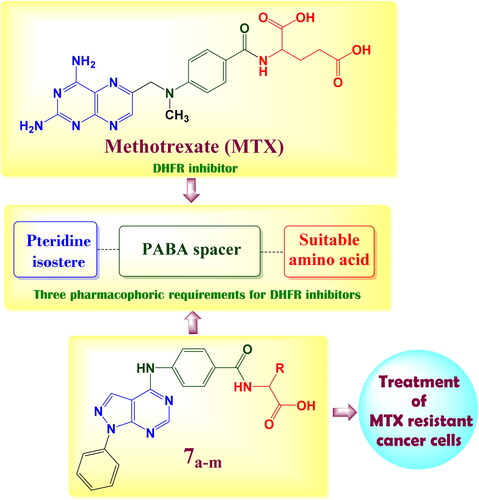
Figure 1. Structural requirements for DHFR inhibition activity.
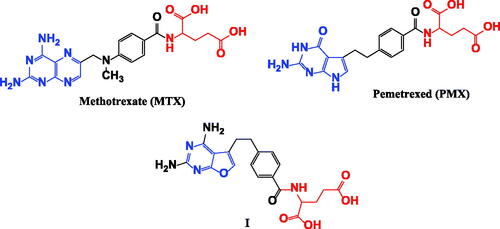
Figure 2. The structural approach between the synthesised novel pyrazolo[3,4-d]pyrimidines 7a–m with MTX reference drug.
![Figure 2. The structural approach between the synthesised novel pyrazolo[3,4-d]pyrimidines 7a–m with MTX reference drug.](/cms/asset/b14cebe3-3f00-40a6-aeaa-218563a3f9a1/ienz_a_2142786_f0002_c.jpg)
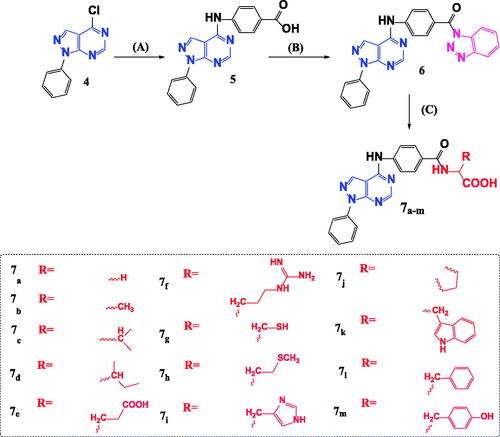
Scheme 2. Synthetic pathway for preparation of novel N-acyl amino acid conjugates 7a–m. Reagents and conditions: A = 4-aminobenzoic acid, isopropanol, heat, 16–18 h. B = 1,2,3 Benzotriazole, SOCI2, DCM, room temp. C = Amino acid, TEA, Acetonitrile, heat 70° C.
Scheme 1. Synthesis of 4-chloro-1-phenyl-1H-pyrazolo[3,4-d]pyrimidine 4. Reagents and conditions: A = Phenyl hydrazine, ethanol, 80° C, 4 h. B = HCONH2, 190° C, 8 h. C = POCI3, 106° C, 6 h.
![Scheme 1. Synthesis of 4-chloro-1-phenyl-1H-pyrazolo[3,4-d]pyrimidine 4. Reagents and conditions: A = Phenyl hydrazine, ethanol, 80° C, 4 h. B = HCONH2, 190° C, 8 h. C = POCI3, 106° C, 6 h.](/cms/asset/bf7e0ca6-7489-48e4-b578-f7eccd42a238/ienz_a_2142786_sch0001_c.jpg)
Table 1. IC50 values of compound 6 and novel N-acyl amino acid conjugates 7a–m in different cell lines.
Figure 3. Western blot quantification anti-DHFR effects of compounds 7c, 7d, 7f, 7j and 7l in MCF-7 breast cancer cell.
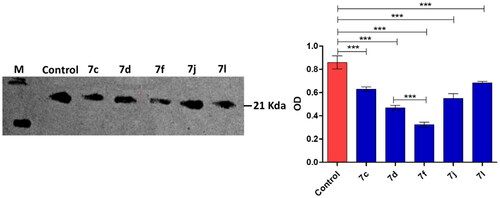
Figure 4. Isosteric approach of compound 7e and MTX along with DHFR inhibition IC50 (µM) values.
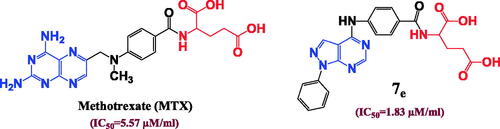
Figure 5. The effect of the structural differences between compounds 7c, 7d, 7f and 7l on their IC50 (µM) values.
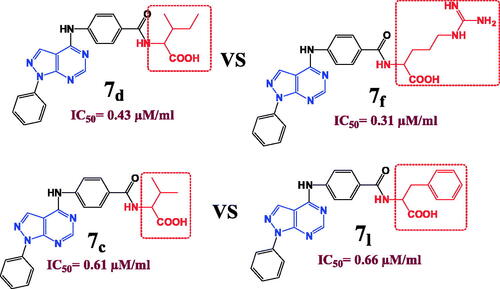
Figure 6. The compound 7f increases the levels of caspases in breast cancer cell line MCF-7. (A) Coulometric assay of caspase 3/7 and Bax levels, the data are presented as percentage change from untreated control. (B) Western blot gel of caspase-3 and Bax and quantification of the intensities of the bands in western blot.
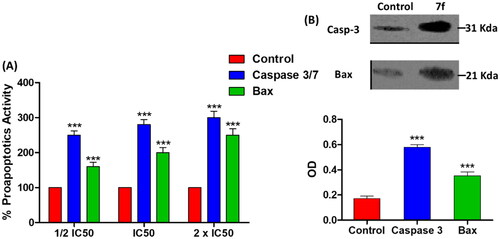
Figure 7. (A) The compound 7f decreases the level of Bacl2 in breast cancer cell line MCF-7. (A) ELISA assay of Bcl2 level, the data are presented as percentage change from untreated control. (B) Western blot gel of Bcl2 and quantification of the intensities of the bands in western blot.
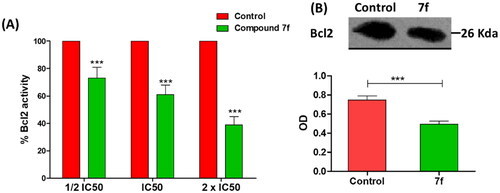
Figure 8. Flow cytometric cell cycle analysis upon treatment of MCF-7 breast cancer cell line with the compound 7f.
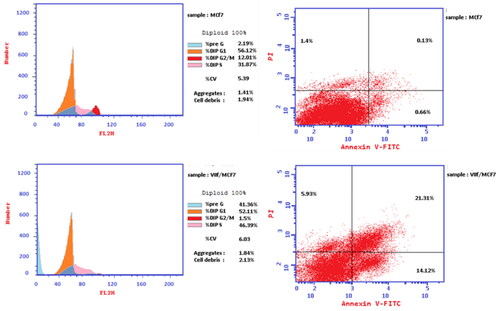
Table 2. Cell cycle analysis and apoptosis detection of the compound 7f.
Table 3. Apoptotic assay of the compound 7f.
Figure 9. Two-dimensional (2 D) and three-dimensional (3 D) binding modes and residues involved in the energy minimised docking pose of the novel compounds 7f, 7d, 7l, 7k and MTX against DHFR (pdb ID: 1U72).
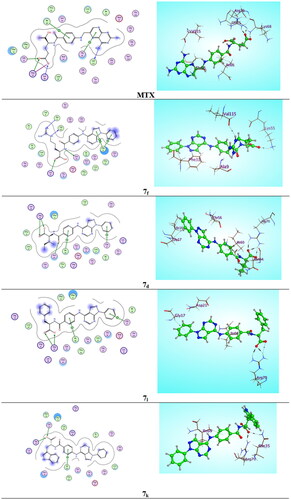
Table 4. Docking scores (kcal/mol) and calculated parameters of Lipinski rule of prepared compounds 6, 7a–m and methotrexate (MTX).
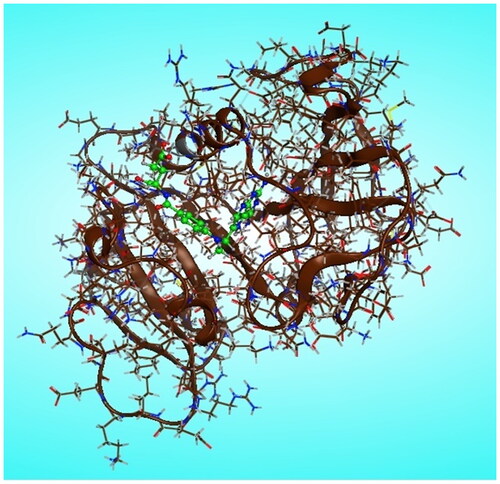
Figure 10. Chain A of DHFR enzyme with (green) methotrexate/NADPH complex ligand in the active site.