Figures & data
Table 1. Composition and manufacture of commercial materials used at the study.
Figure 1. Chemical structures of the two arylsulphonyl-ureido-benzenesulphonamides SULFA1 and SULFA2 and their inhibitory activity against S. mutans β-CA (SmuCA).
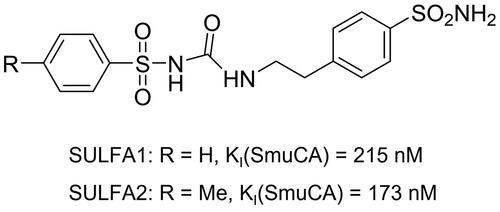
Table 2. Relative fluorescence intensity emitted by the action of dentine gelatins.
Table 3. Average values (± DP) of bond strength after storage in distilled water (24 h and 12 months) and cariogenic challenge (CC) by microtensile bond strength assay (MPa).
Figure 2. Graphical representation of failure patterns (%) after storage in distilled water for 24 h, 12 months and after cariogenic challenge (CC).
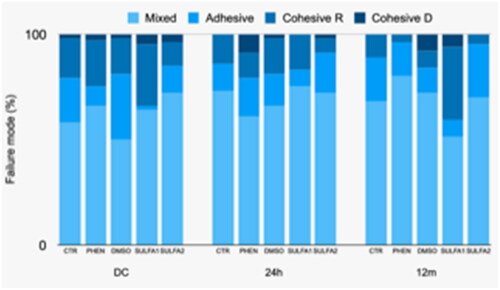
Figure 3. (A) Average values (±DP) of the contact angle. Slashes by different capital letters are statistically different (HSD of Tukey, p < 0.05). (B) Representative images of the groups: A-SULFA1; B-SULFA2; C-DMSO; D-PHEN; E-CTR. ↓ drop of adhesive in contact with the dentine, forming the contact angle.
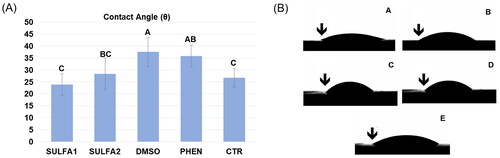
Figure 4. Representative FT-IR spectra after inhibitor application (A) and after storage in collagenase solution for 15 days (B).
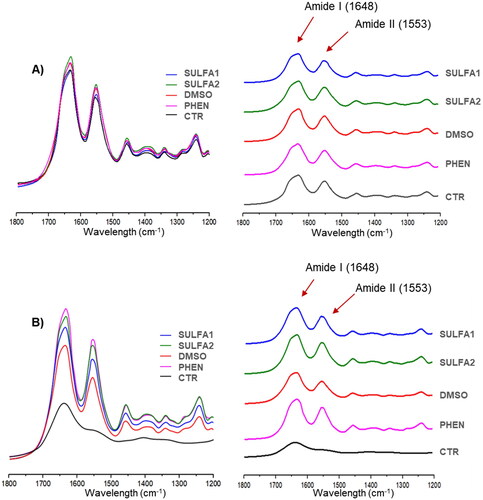
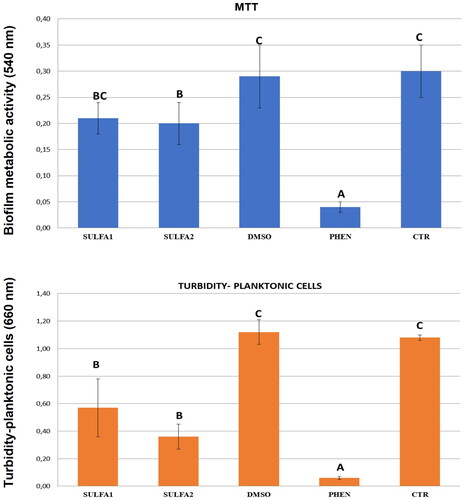
Figure 5. Average values (±DP) for S. mutans biofilms in different types of surface treatment: MTT (metabolic activity) and Turbidity (planktonic cells). Slashes by different capital letters are statistically different (HSD of Tukey, p < 0.05).