
Figures & data
Figure 1. A schematic representation of pyridone derivative I complexed with PIM-1 kinase. Dashed lines indicated hydrogen bonds.
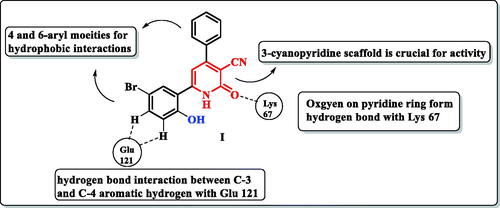
Figure 2. Quinoline and quinolone having PIM-1 kinase inhibitory activity.
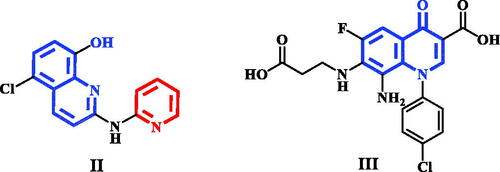
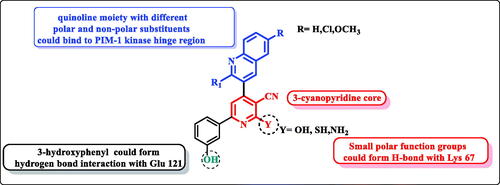
Figure 3. Design of pyridine-quinoline hybrids.
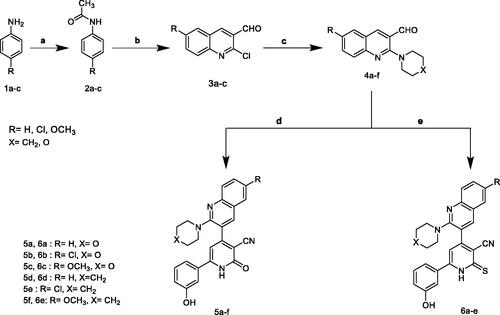
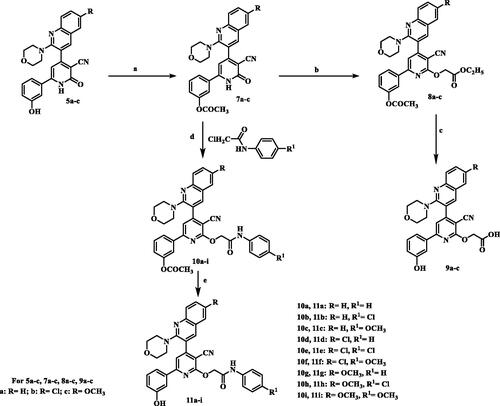
Scheme 1. Synthesis of 2-pyridone/2-thioxopyridine – quinoline hybrids. (a) Ac2O; (b) POCI3/DMF; (c) morpholine or piperdiine/ K2CO3/DMF; (d) 3-hydroxyacetophenone / ammonium acetate/ CNCH2COOC2H5/ ethanol, reflux; (e) 3-hydroxyacetophenone /ammonium acetate / CNCH2CSNH2/ ethanol, reflux.
Scheme 2. Synthesis of 2-O-substitutedpyridine – quinoline hybrids. (a) Ac2O, reflux; (b) BrCH2COOC2H5/K2CO3, reflux; (c) NaHCO3 / reflux; (d) K2CO3, reflux; (e) NaHCO3/ reflux.
Scheme 3. Synthesis of 2-pyridone/2-thiopyridine/2-aminopyridine – quinolone hybrids. (a) CH3COOH, reflux; (b) 3-hydroxyacetophenone / ammonium acetate/ CNCH2COOC2H5/ ethanol, reflux; (c) 3-hydroxyacetophenone /ammonium acetate / CNCH2CSNH2/ ethanol, reflux; (d) 3-hydroxyacetophenone /ammonium acetate / CNCH2CN/ ethanol, reflux.
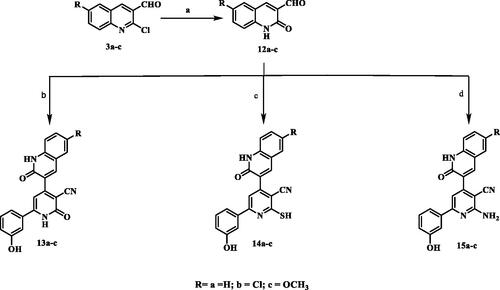
Figure 4. IC50 and EC100 (μM) of the tested compounds against normal human cells (wi-38).
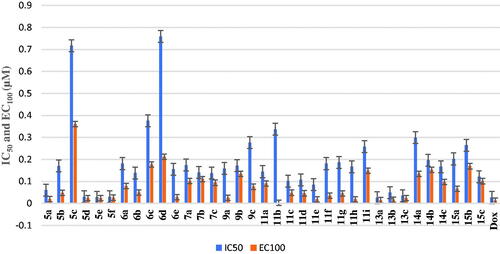
Figure 5. In vitro anticancer activity, IC50 (μM), of the tested compounds against Caco-2.
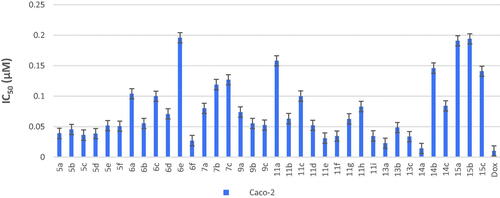
Figure 6. In vitro anticancer activity, IC50 (μM), of the tested compounds against HepG-2.
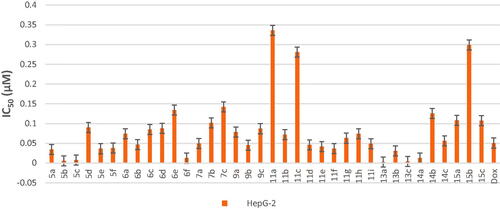
Figure 7. In vitro anticancer activity, IC50 (μM), of the tested compounds against NFS-60.
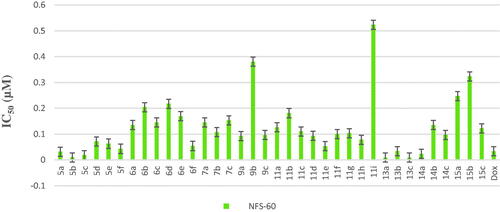
Figure 8. In vitro anticancer activity, IC50 (μM), of the tested compounds against PC-3.
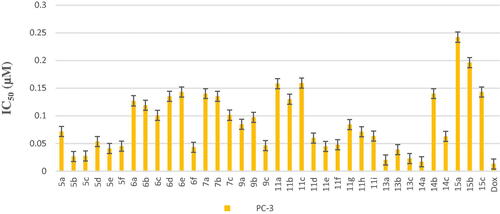
Figure 9. Morphological alterations of the most active compounds-treated cancer cells lines in comparison with the untreated cancer cells.
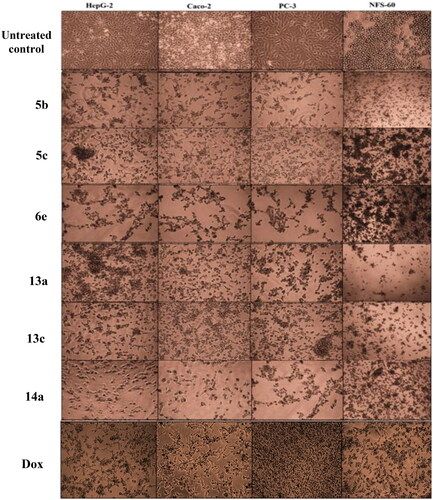
Figure 10. Flow charts of Annexin-PI analysis of 5b, 5c, and 6e – treated cancer cell lines in comparison with the untreated cancer cells.
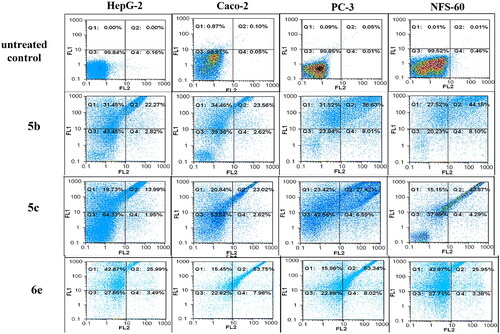
Figure 11. Flow charts of Annexin-PI analysis of 13a, 13c, and 14a – treated cancer cell lines in comparison with the untreated cancer cells.
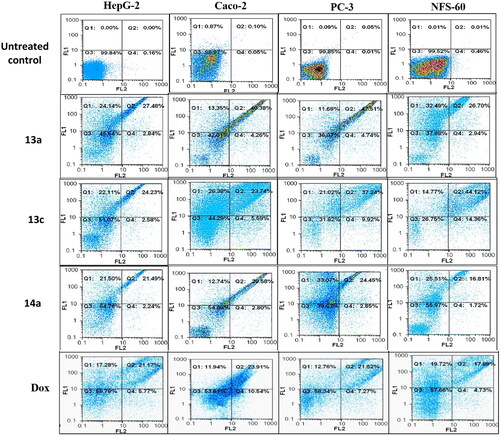
Figure 12. Lineweaver–Burk double-reciprocal plot for PIM kinase inhibition by 5c, 5b, and 6e in comparison with quercetin as reference inhibitor.
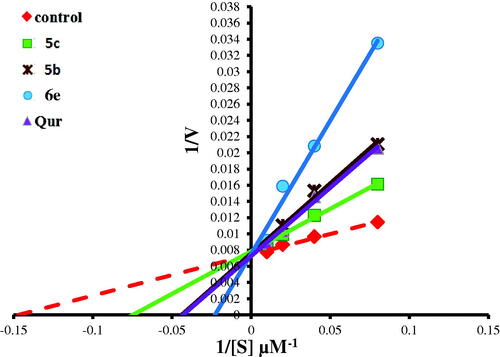
Table 1. The total percentage of the apoptotic cell population in the most effective compounds-treated cancer cells lines.
Table 2. Illustrates relative fold increase in caspase activity by the most effective compounds relative to untreated HepG2 cancer cells.
Table 3. In-vitro PIM-1 and PIM-2 kinase inhibition data of the most active compounds.
Figure 13. Lineweaver–Burk double-reciprocal plot for PIM kinase inhibition by 13a and 14a in comparison with quercetin as reference inhibitor.
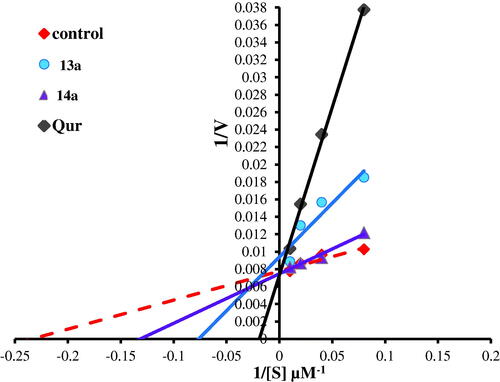
Figure 14. (A) Overlay of the X-ray co-crystal (simon sticks) on its docked pose (cyan sticks) in the binding site of PIM-1 kinase (PDB ID: 2OBJ). (B) Overlay of the docking poses of 5b, 5c, and 6e as green, cyan, and magenta sticks, respectively, in the binding site of PIM-1 kinase. (C) Interaction pattern of 5c with PIM-1 residues in 2D depictions. Polar and non-polar regions of the binding site were presented by red and green coloured molecular surface, respectively. Dashed lines indicate favourable interactions. Non-polar hydrogen atoms were omitted for clarity.
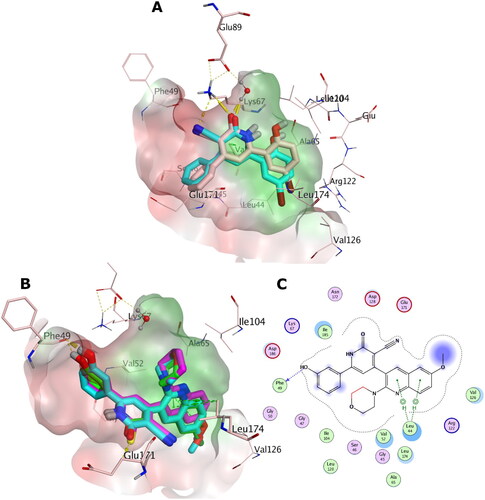
Table 4. LE and LLE values for the most active anticancer compounds against the four cancer cell lines (HepG-2, Caco-2, PC-3, NFS-60).
Figure 15. (A) Overlay of the docking poses of 13a, 13c, and 14a as magenta, green, and cyan sticks, respectively, in the binding site of PIM-1 kinase. (B) Interaction pattern of 13a, 13c, and 14a with PIM-1 residues in 2D depictions. Polar and non-polar regions of the binding site were presented by red and green coloured molecular surface, respectively. Dashed lines indicate favourable interactions. Non-polar hydrogen atoms were omitted for clarity.
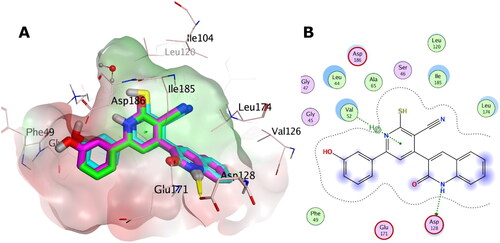
Table 5. The docking score distribution of 5b, 5c, 6e, 13a, 13c, 14a and Quercetin against PIM-1 and PIM-2 kinases.
Figure 16. (A) Overlay of the X-ray co-crystal (grey sticks) on its docked pose (cyan sticks) in the binding site of PIM-2 kinase (PDB ID: 4X7Q). (B) Overlay of the docking pose of 5b, 5c, and 6e as green, cyan, and magenta sticks, respectively, in the binding site of PIM-2 kinase. (C) Interaction pattern of 5b with PIM-2 residues in 2D depictions. Polar and non-polar regions of the binding site were presented by red and green coloured molecular surface, respectively. Dashed lines indicate favourable interactions. Non-polar hydrogen atoms were omitted for clarity.
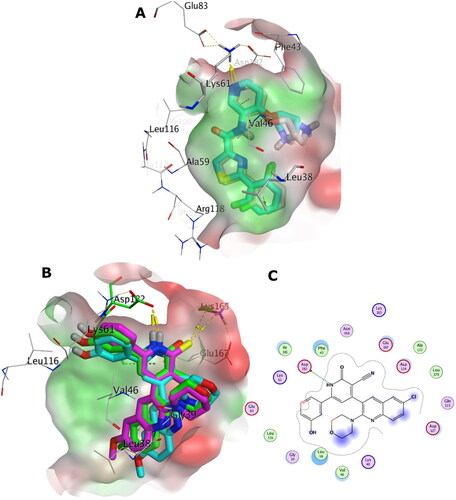
Table 6. In-silico predictions of the pharmacokinetics and drug-likeness properties for 5b, 5c, 6e, 13a, 13c and 14a.