Figures & data
Figure 1. A ribbon diagram of the SGK1 kinase. The C-terminal domain, in orange, shows a α-helical disposition, while the N-terminal domain, in blue, has a β-strand secondary structure. The two domains are linked by the activation loop, where resides the amino acid Thr256, needed for its activation. Residues Asp177 and Ile179, which form hydrogen bonds with SGK1 inhibitors, and the catalytic Lys127, are located in the ATP-binding site.
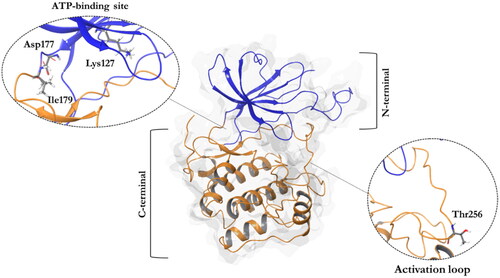
Figure 2. Structure of commercial inhibitors of SGK1.
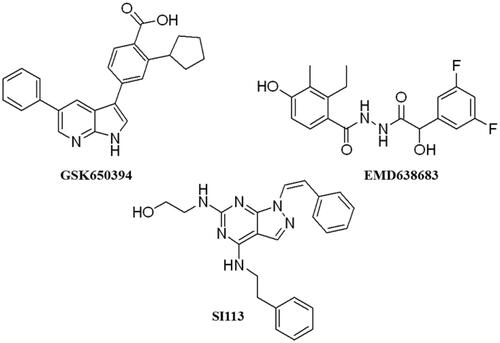
Figure 3. BBB penetration of SGK1 inhibitors according to the BOILED-egg model. The white region corresponds to the chemical space with highest probability of exert good gastrointestinal absorption, while the yellow region corresponds to the chemical space with highest probability to reach the CNS. WLOGP: Wildman and Crippen log P (n-octanol/water partition coefficient); TPSA: topological polar surface area.
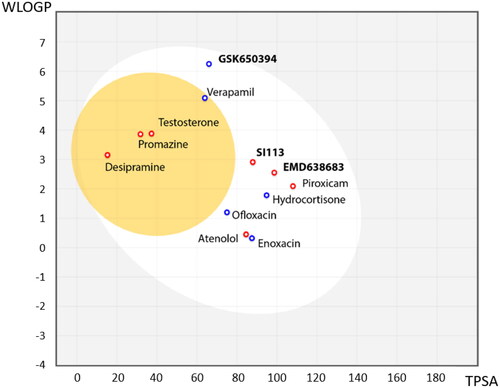
Figure 4. Representation of SGK1 crystalised with the ligand MMG.
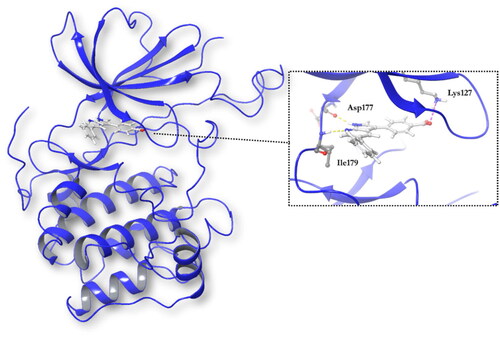
Table 1. Compounds selected from the target-based screening based on their docking score (XP Gscore) and structural diversity.
Table 2. Inhibitory values of compounds against SGK1.
Figure 5. Representation of the binding mode of A) VNG1.6 and B) GMH1.1 in the catalytic site of the crystallised protein SGK1 (3HDM).
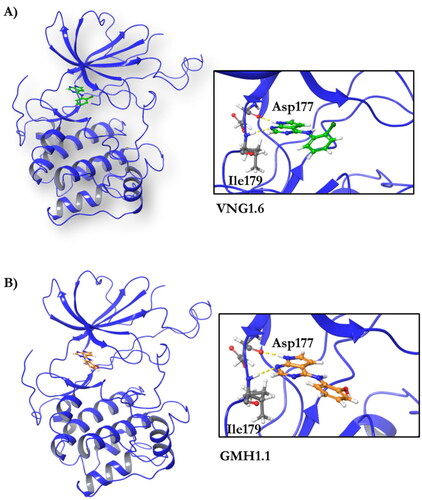
Table 3. Inhibitory values of deazapurine related compounds against SGK1 and their IC50.
Figure 6. BBB penetration of SGK1 inhibitors from the MBC library according to the BOILED-egg model. WLOGP: Wildman and Crippen log P (n-octanol/water partition coefficient); TPSA: topological polar surface area.
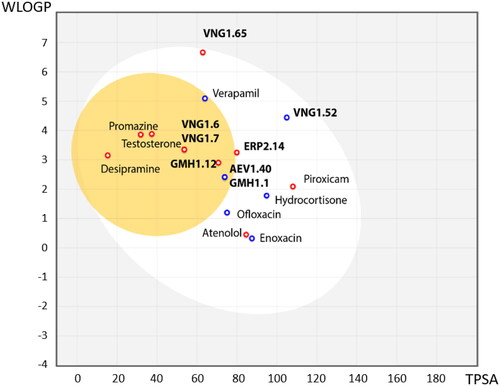
Figure 7. ERP1.22 species distribution. A) pH dependent distribution of the ligand species. B) Tautomeric population of the ligand at its neutral ionisation state.
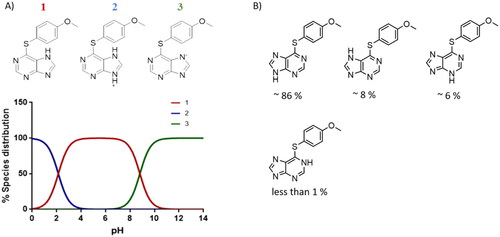
Figure 8. Description of the iMLS reporter.
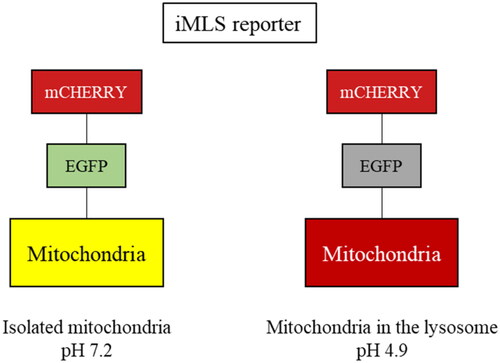
Figure 9. Mitophagy modulation by SGK1 inhibitors. (A,B) Basal and (C,D) induced mitophagy were measured in U2OS-iMLS PRKN and U2OS-iMLS cells treated with the compounds at 10 µM and/or the inducers FCCP and DFP for 24 h. (E) Representation of U2OS-iMLS cells treated as indicated. Scale bar = 50 µm. Data represent the mean ± SD of three replicates in (A–C) and the mean ± SEM of four independent experiments in (B–D). (Significance was determined by one-way ANOVA followed by Dunnett’s multiple comparison test to control, where ****p < 0.0001 versus control in (A,B) and * p < 0.05 versus FCCP or DFP in (C,D), respectively).
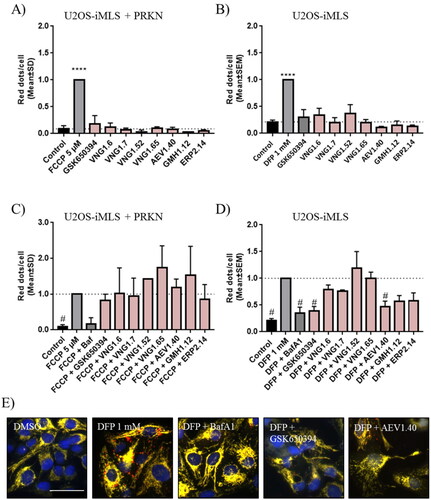
Figure 10. Citrate synthase activity in SH-SY5Y cell line. Cells were treated with DFP 1 mM and/or GSK650394 and AEV1.40 10 μM for 24 h. Data represents mean ± SEM of four independent experiments. (Significance was determined by one-way ANOVA followed by Dunnett’s multiple comparison test to control, where ** p < 0.01 versus control and # p < 0.05 versus DFP).
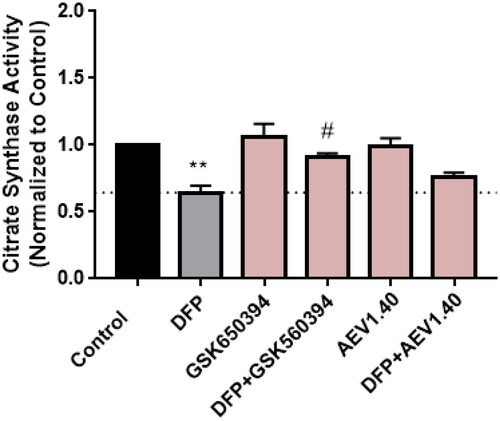
Figure 11. Neuroprotective effect of SGK1 inhibitors in AD cellular model. A) SH-SY5Y cells were treated with the compounds at 10 µM for 24 h. B) Cells were pre-treated with the compounds at 10 µM for 1 h followed by the treatment with OA 30 nM for 24 h. Data were normalised to control and represent mean ± SEM of three independent experiments. (Significance was determined by one-way ANOVA followed by Dunnett’s multiple comparison test to control, where *** p < 0.001 versus control and ## p < 0.01 versus OA).
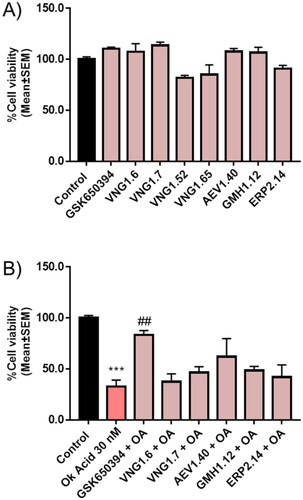
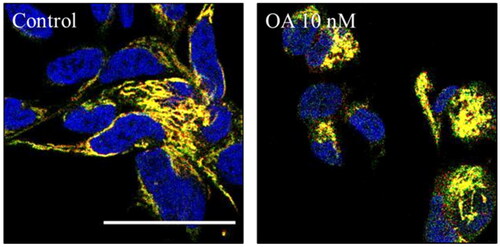
Figure 12. Mitophagy modulation by OA. A) Representation and quantification of SH-SY5Y MitoQC cells treated with OA 10 nM. Data represent mean ± SD of replicates from one experiment. Scale bar = 30 µm.