Figures & data
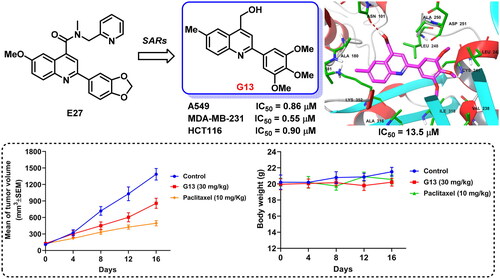
Figure 1. (A) Eight distinct tubulin-ligand binding sites that have been reported so far. (B) Schematic representation of the colchicine binding site in tubulin (PDB code: 4O2B). (C) Representative colchicine binding site inhibitors.
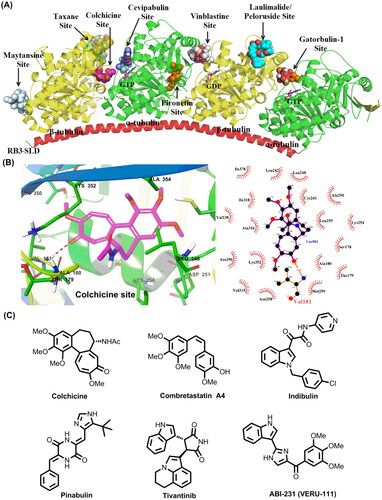
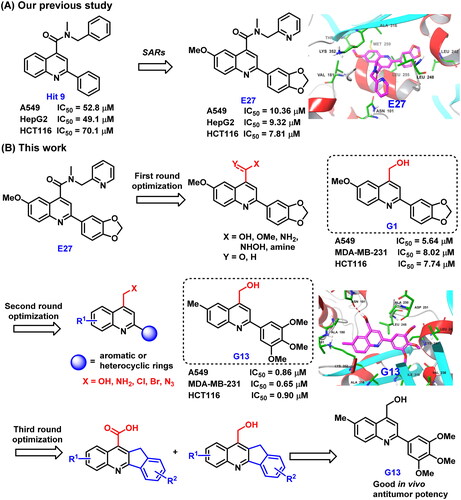
Figure 2. (A) Our previous study identified 2-aryl-4-amide-quinoline derivatives as the novel colchicine binding site inhibitors. (B) Rational drug design and structural optimisation were performed to identify analogue G13 displaying potent antitumour activity.
Scheme 1. Reagents and conditions: (a) 33% KOH, EtOH, 80 °C ∼ 100 °C, 24 h; HCl, H2O, rt, pH = 2. (b) For D1 and D2: SOCl2, DCM, reflux 6 h, then methanol or ammonia added; For D3: CDI, THF, NH2OH·HCl, rt. (c) Amine, EDC, DMAP, DCM, rt. (d) LiAlH4, THF, 0 °C. (e) For G21: SOCl2, DCM, 0 °C; For G22: NBS, PPh3, DCM, rt. (g) DMF, NaN3, rt. (h) THF/H2O, PPh3. (i) NaBH4/BF3·OEt2, THF, rt.
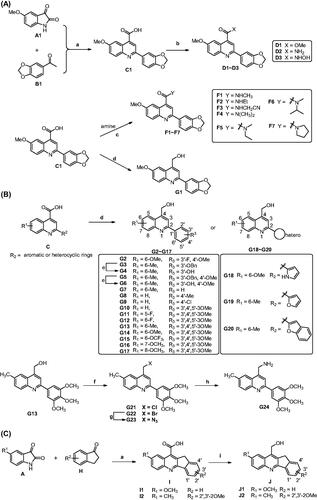
Table 1. In vitro antitumour activity of compounds C1∼J2 (IC50, μM).
Figure 3. Summary of SARs for analogues C1∼J2.
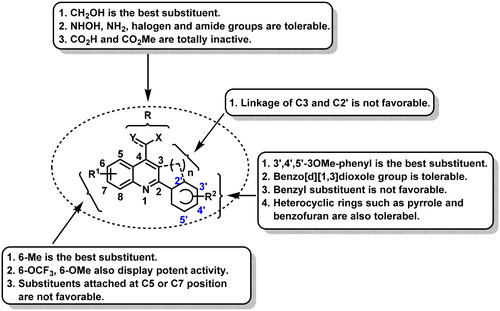
Figure 4. (A) Tubulin polymerisation inhibitory activity of G13. (B) Tubulin polymerisation inhibitory activity of colchicine. (C) The binding mode of G13 with tubulin. (D) The overlapped binding modes of G13 (pink) and colchicine (blue).
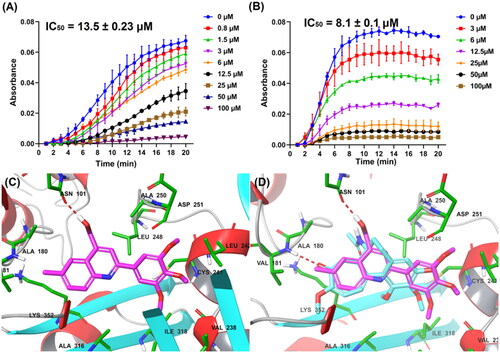
Figure 5. (A) The wound healing assay was performed using MDA-MB-231 cells treated with G13 (0.5 μM or 1 μM) or colchicine (0.5 μM) for 24 h. The black and green dash lines indicated the edge of the scratch at 0 h and 24 h, respectively. (B) The wound closure area was measured by ImageJ software. (C) The transwell invasion assay was performed using MDA-MB-231 cells treated with G13 (0.5 μM, 1 μM or 5 μM) or colchicine (0.5 μM) for 24 h. (D) The relative migration rate was calculated by comparing with the control group. (E) The tube formation assay was performed using HUVECs treated with G13 (0.1 μM, 0.5 μM or 1 μM) for 6 h, then capillary-like networks were captured by the inverted microscope. Scale bar = 200 μm. The results are presented as the mean ± standard deviation. *p < .05, **p < .01, ***p < .001, and ****p < .0001, determined with unpaired t test.
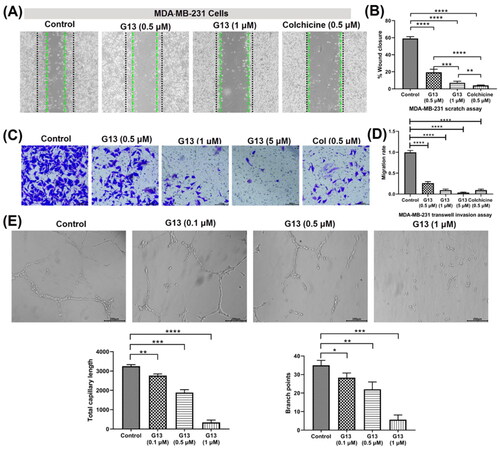
Figure 6. Transmission electron micrographs of MDA-MB-231 cells treated with 0.1% DMSO (control group), G13 (5 μM) or colchicine (5 μM) for 48 h. The green area in the top micrographs was enlarged below the micrographs. The yellow arrows illustrated a lot of fat droplets in cells. The red arrows illustrated the ultrastructural alterations of mitochondria. The pink arrows indicated the endoplasmic reticulum became dilation. Cells treated with G13 or colchicine resulted in the formation of polynuclear cells.
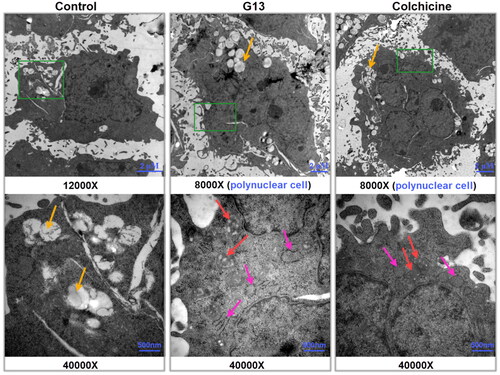
Figure 7. MDA-MB-231 cells were treated with 0.1% DMSO (control group), G13 (1 μM) or colchicine (1 μM) for 24 h, then the change of microtubule networks was visualised using confocal immunofluorescent microscopy. Scale bar = 10 μm.
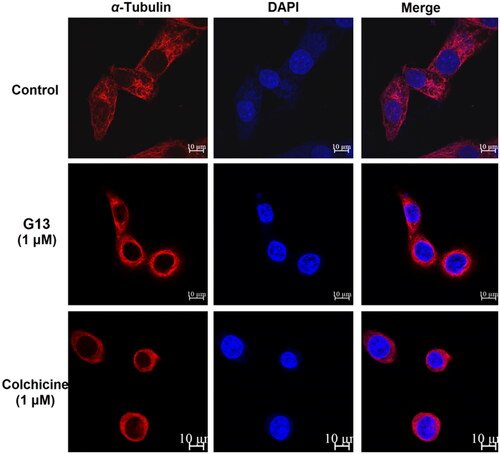
Figure 8. Induction of apoptosis and cell-cycle arrest by G13 in MDA-MB-231 cells. (A) MDA-MB-231 cells were treated with 0.1% DMSO (control group), G13 (1 μM or 5 μM) or colchicine (5 μM) for 24 h, stained with annexin V-FITC/PI apoptosis detection kit and analysed by flow cytometry. (B) Cell cycle analysis after treatment with 0.1% DMSO (control group), G13 (0.5 μM) or colchicine (0.5 μM) for 24 h. The data are representative of two independent experiments.
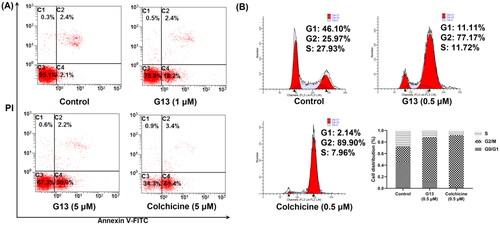
Figure 9. The effect of G13 on MMP and intracellular ROS level in MDA-MB-231 cells. (A) MDA-MB-231 cells were treated with 0.1% DMSO (control group), or G13 (1 μM or 5 μM) for 24 h, stained with JC-1 dye and analysed by flow cytometry. (B) ROS level was detected after treatment with 0.1% DMSO (control group), or G13 (1 μM or 5 μM) for 24 h. The data are representative of two independent experiments.
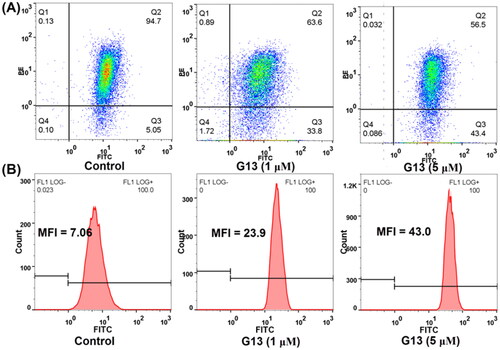
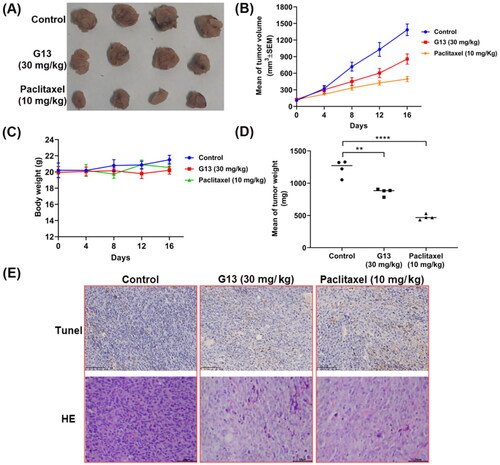
Figure 10. In vivo antitumour potency of G13 in MDA-MB-231 xenograft model. (A) Picture of dissected tumour tissue. (B) Change in tumour size. (C) Change in body weight. (D) Tumour weight. (E) TUNEL and H&E staining pictures of dissected tumour tissue. **p < .01, ****p < .0001, as determined by unpaired t test.