Figures & data
Scheme 1. Synthetic pathway of 1-arylsulfonyl-aziridine-2-carboxylic acid derivatives (Scaffolds I–III, for definition of substituents see ).
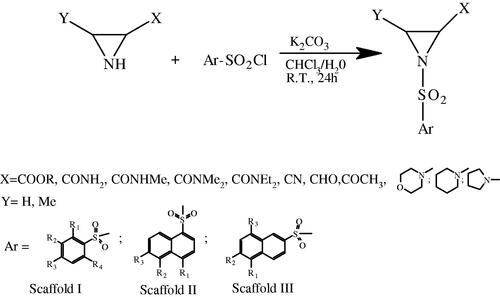
Table 1. PDIA1 inhibiting activity of benzene sulphonamides of aziridine-2-carboxylic acid derivatives (Scaffold I).
Table 2. PDIA1 inhibiting activity of 1-naphthalene sulphonamides of aziridine-2-carboxylic acid derivatives (Scaffold II).
Table 3. PDIA1 inhibiting activity of 2-naphthalene sulphonamides of aziridine-2-carboxylic acid derivatives (Scaffold III).
Figure 1. PDIA1 inhibiting activity of p-substituted benzosulphonamides of Az-COOMe with aliphatic chain of various lengths (from C1 to C12).
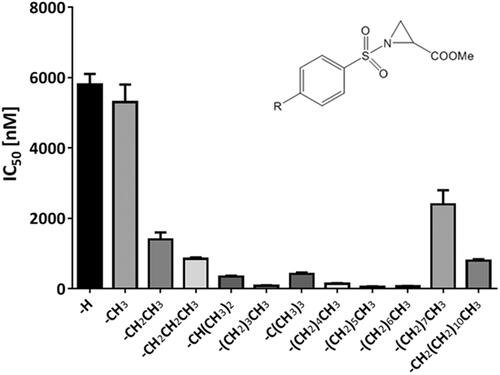
Figure 2. 2D 1H-15N HSQC spectra of the reduced form of uniformly labelled 15 N-PDIA1a apo-protein (blue) and protein–ligand complex with C-3399 at 1:1 ratio (red) and 1:2 ratio (green) in 10 mM AcOH-NaOH pH 5.1, 50 mM NaCl.
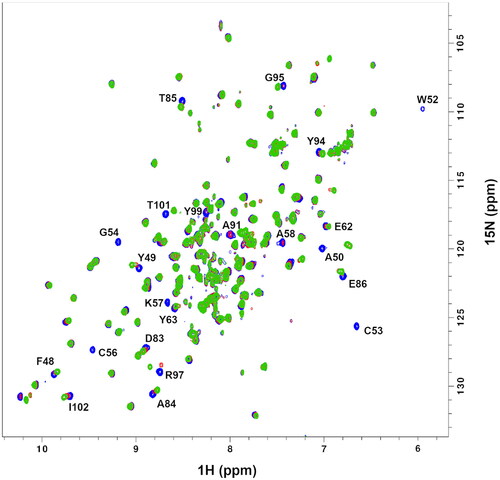
Figure 3. 2D 1H-15N HSQC spectra of the reduced form of uniformly labelled 15 N-PDIA1a apo-protein (blue) and protein–ligand complex with C-3389 at 1:1 ratio (red) and 1:2 ratio (green) in 10 mM AcOH-NaOH pH 5.1, 50 mM NaCl.
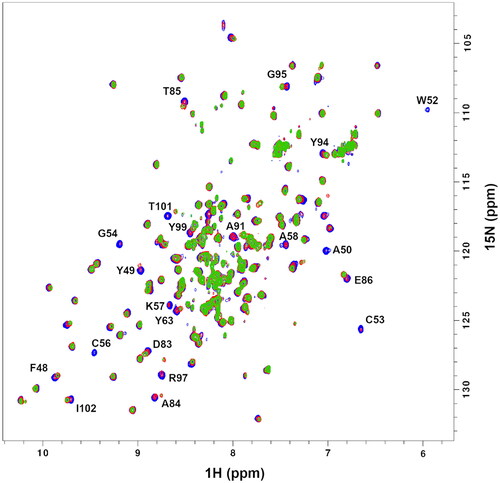
Figure 4. Chemical shift perturbation, δ, plots for PDIA1a complex with covalently bound C-3399 (A) and C-3389 (B). Disappeared residues (W52, C53, G54, C56, K57, A58, and Y99) were excluded from the comparison.
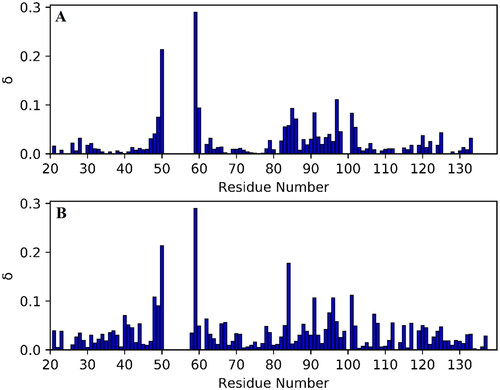
Table 4. The in vitro antiproliferative effect of benzene sulphonamides of aziridine-2-carboxylic acid derivatives (Scaffold I) towards panel of cancer cells.
Table 5. Inhibiting activity of 1-naphthalene sulphonamides of aziridine-2-carboxylic acid derivatives (Scaffold II) towards panel of cancer cell lines in vitro.
Table 6. Inhibiting activity of 2-naphthalene sulphonamides of aziridine-2-carboxylic acid derivatives (Scaffold III) towards panel of cancer cells in vitro.
Table 7. Cytotoxicity of aromatic sulphonamides (Scaffolds I–III) towards mouse Swiss Albino embryo fibroblast cells (Balb/c 3T3).
Figure 5. The influence of PDIA1 inhibitor C-3251 on the clonogenic potential (A, B), cell death (C, D) and cell cycle (E) of human colon cancer HT-29 and CaCo-2 cells. Dashed line designated control level. Data represent the means ± SD of least three independent experiments. Statistical analysis was performed using Kruskal–Wallis followed by Dunn’s (A, C: CaCo-2), one-way ANOVA followed by Sidak’s (A, C: HT-29; D) or two-way ANOVA followed by Dunnett’s (E) multiple comparisons test (*p = 0.05, **, ##p = 0.01, ***p = 0.001, ****, ####p = 0.0001).
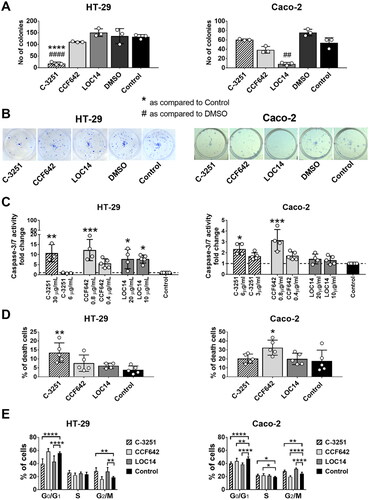
Figure 6. Cytostatic activity of C-3281 (i.p., 5 mg/kg for 16 days and 15 mg/kg for 16 days), C-3329 (i.p., 100 mg/kg for 16 days) and C-3342 (i.p. 170 mg/kg for 16 days) on Lewis lung carcinoma model in mice.
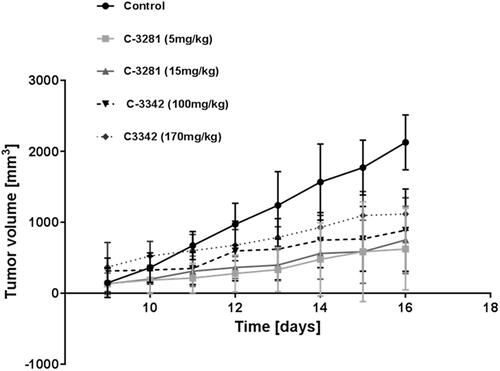
Figure 7. Inhibition of tumour growth in Lewis lung carcinoma control group (1) and Lewis lung carcinoma mice groups (2–5) treated with C-3281 (i.p., 5 mg/kg) for 16 days (2), C-3281 (i.p., 15 mg/kg, for 16 days) (3), C-3342 (i.p., 170 mg/kg for 16 days) (4) and C-3329 (i.p., 100 mg/kg for 16 days) (5).
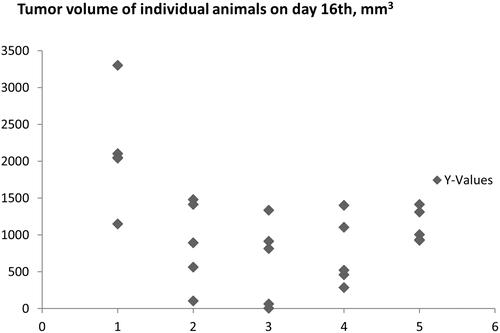
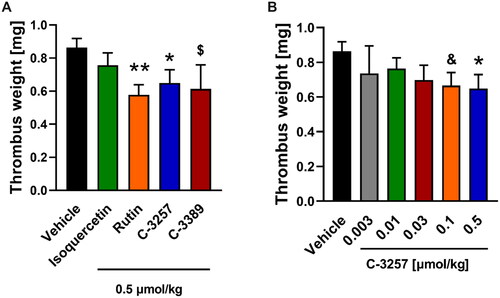
Figure 8. Anti-thrombotic effects of reference PDIA1 inhibitors (A) and C-3257 (B) in arterial thrombosis in rats under in vivo conditions. Data are means with SEM; n = 5–11, $, &, * or ** indicate p = 0.068, p = 0.054, p < 0.05 and p < 0.01 respectively vs. corresponding vehicle control. Statistical analysis was performed using Student’s t-test or Mann-Whitney test.