
Figures & data
Figure 1. Localisation of the 12 residues (shown in green) associated to the 13 ClinVar VUS analysed. The protein sequence corresponding to the DMS is highlighted in purple.
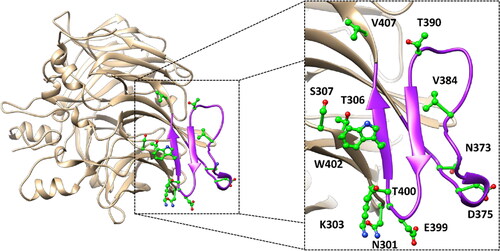
Figure 2. MD results obtained for the nine dimeric models of hRPE65 including K303N, N373S, D375N, D375H, E399K, T390I, V407A, T400S and W402S variants. A), B) RMSD of the DMS α carbons during 3 µs of MD simulation obtained for the mutated monomers compared to WT. C), D) RMSF of the α carbons of the whole mutant monomers compared to WT.
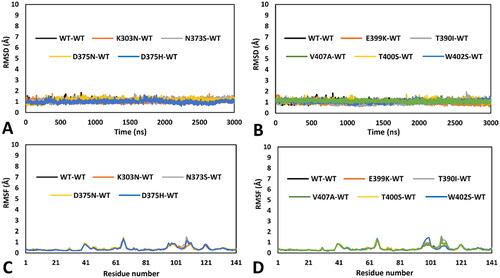
Figure 3. Residue-specific pairwise interactions observed for the mutated residues in the models of the analysed VUS, compared to the WT model. A) K303N (orange), B) N373S (gray), C) D375N (yellow), D) D375H (blue). All VUS structures displayed correspond to the minimised average structure obtained from the last µs of MD simulation, which are shown superimposed to the minimised average structure of the WT model (colored black in all panels). Direct H-bonds are shown as black dashed lines. Water-mediated interactions are showed as cyan dotted lines.
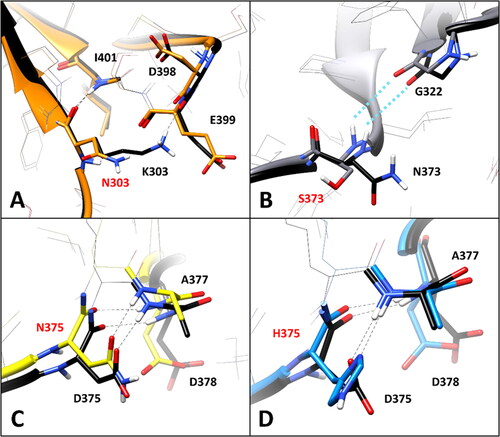
Figure 4. Residue-specific pairwise interactions observed for the mutated residues (labelled with red font) in the models of the analysed VUS, compared to the WT model. A) E399K (orange), B) T390I (gray), C) V407A (green), D) T400S (yellow), E) W402S (blue). All VUS structures displayed correspond to the minimised average structure obtained from the last µs of MD simulation, which are shown superimposed to the minimised average structure of the WT model (colored black in all panels). Direct H-bonds are shown as black dashed lines.
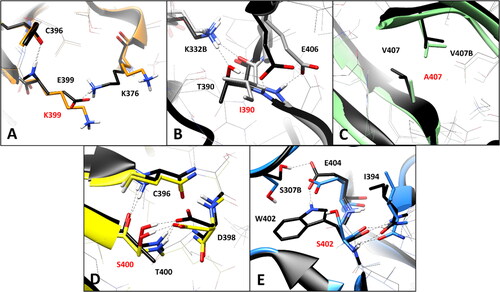
Figure 5. MD results obtained for the four dimeric models of hRPE65 including N301S, S307F, V384F and T306I variants. A) Superimposed average structures of the mutated monomers, obtained from the last µs of MD simulation, compared to the WT structure, and inset image focussed on the partially misfolded region. B) RMSD of the DMS α carbons during 3 µs of MD simulation obtained for the mutated monomers compared to WT. C) RMSF of the α carbons of the whole mutated monomers compared to WT.
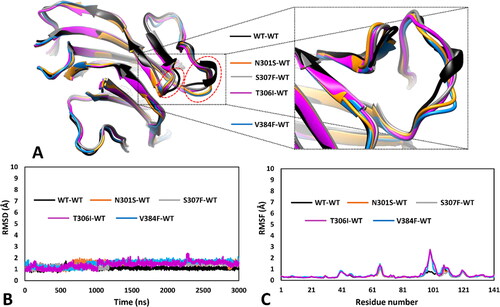
Figure 6. Residue-specific pairwise interactions observed for the mutated residues (labelled with red font) in the models of the analysed VUS, compared to the WT model. A) N301S (orange), B) S307F (gray), C) V384F (blue), D) T306I (magenta). All VUS structures displayed correspond to the minimised average structure obtained from the last µs of MD simulation, which are shown superimposed to the minimised average structure of the WT model (colored black in all panels). Direct H-bonds are shown as black dashed lines.
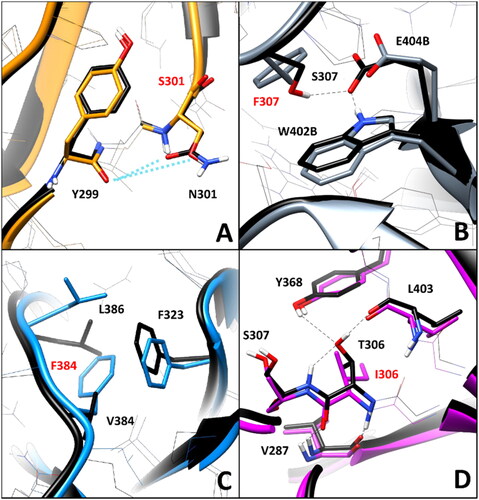
Table 1. Statistical results obtained for the 19 selected bioinformatics tools.
Table 2. Consensus bioinformatics predictions obtained for the first set of analysed hRPE65 VUS.
Table 3. Consensus bioinformatics predictions obtained for the second set of analysed hRPE65 VUS.
Table 4. Classification of DMS-focussed hRPE65 missense VUS based on the overall pathogenicity evaluation. The presence (+) or absence (−) of each pathogenicity alert is shown for each variant.