Figures & data
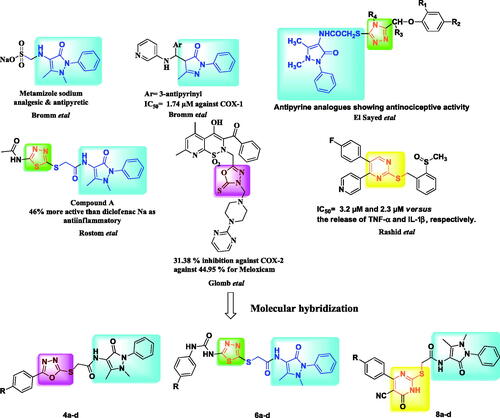
Figure 1. Chemical structures of certain reported antipyrine, oxadiazolyl, thiadiazolyl, pyrimidinyl analogues and our designed compounds (4,6,8).
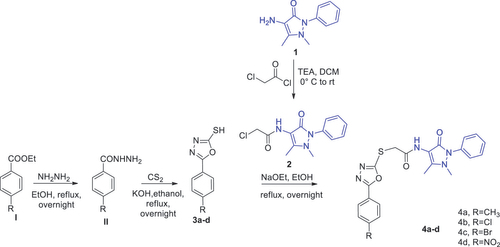
Scheme 1. Synthetic pathway of 1,3,4-oxadiazolyl antipyrine derivatives (4a-d).
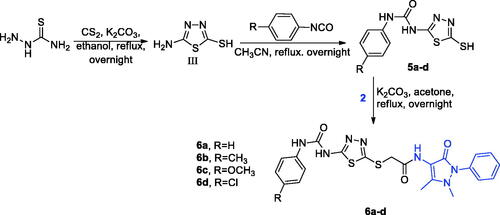
Scheme 2. Synthetic pathway of 1,3,4-thiadiazoles derivatives (6a-d).
Scheme 3. Synthetic pathway of pyrimidines derivatives 8a-d.
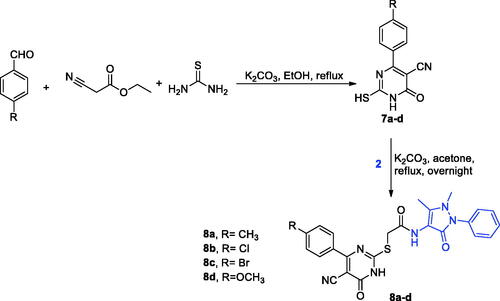
Table 1. IC50 values of the tested compounds as COX inhibitors.
Figure 2. (A) Proposed binding interactions of compound 4b into COX-1 enzyme (PDB ID 6Y3C). (B) Proposed binding interactions 4b into COX-2 enzyme (PDB ID 5KIR). Important residues in the active site are indicated by lines, while the gray dotted lines are used for representing H-bonds. For the sake of clarity, nonpolar Hs were removed. In the ligand-interaction diagrams the magenta arrow represents the H-bond, the green line the π–π stacking, the red line the cation-π stacking.
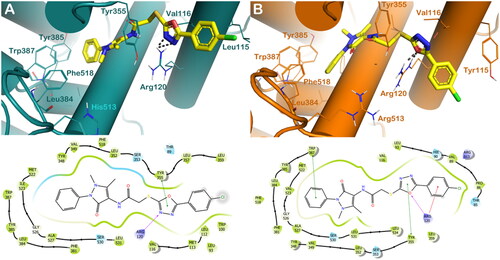
Figure 3. (A) Proposed binding interactions 4c into COX-1 enzyme (PDB ID 6Y3C). (B) Proposed binding interactions 4c into COX-2 enzyme. In the ligand-interaction diagrams the magenta arrow represents the H-bond, the green line the π–π stacking, the red line the cation-π stacking.
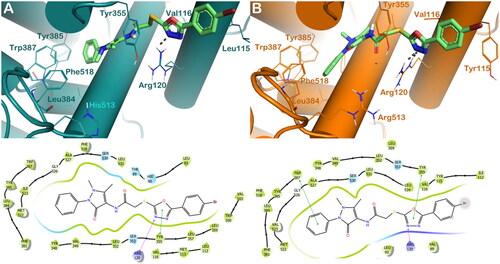
Figure 4. (A) Proposed binding interactions 6c into COX-1 enzyme (PDB ID 6Y3C). (B) Proposed binding interactions 6c into COX-2 enzyme. In the ligand-interaction diagrams the magenta arrow represents the H-bond, the green line the π–π stacking, the red line the cation-π stacking.
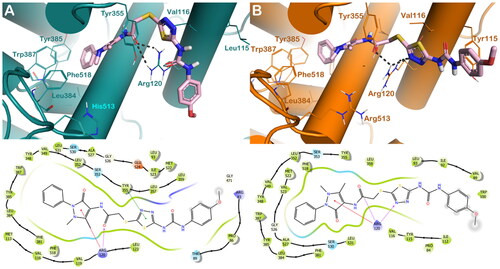
Figure 5. (A) Proposed binding interactions 8d into COX-1 enzyme (PDB ID 6Y3C). (B) Proposed binding interactions 8d into COX-2 enzyme. In the ligand-interaction diagrams the magenta arrow represents the H-bond, the green line the π–π stacking, the red line the cation-π stacking.
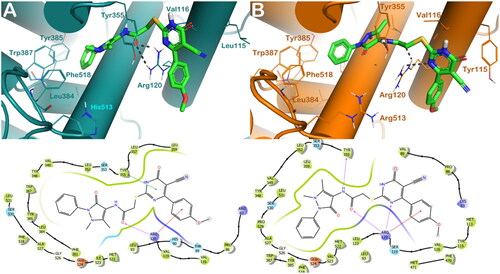
Figure 6. Effects of celecoxib (CLX), 4 b, and 4c on carrageenan-induced paw edoema. *** p < 0.001 compared to the carrageenan group.
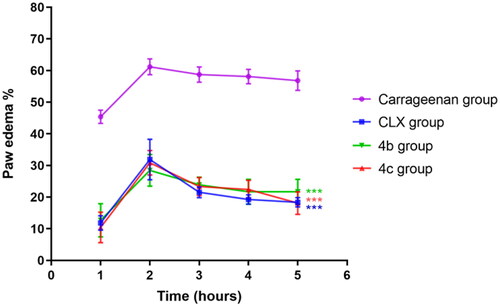
Figure 7. (A) Representative images of hematoxylin-eosin-stained paw sections showing areas of inflammation (arrows). (B) Semi-quantitative scoring of inflammation. *** p < 0.001 compared to the control group; # p < 0.05 compared to the carrageenan group.
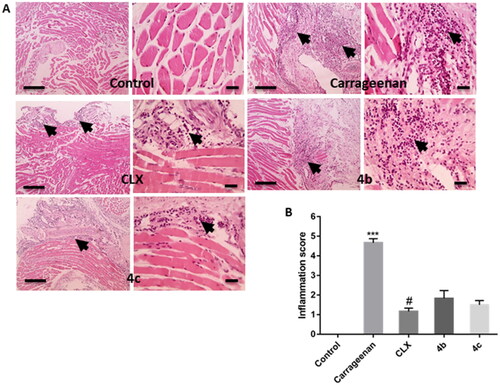
Figure 8. (A) Representative images of immunostained paw sections showing NF-κB positive expression (arrows). (B) Semi-quantitative scoring of NF-κB positive expression. *** p < 0.001 in comparison to the control group; # p < 0.05 compared to the carrageenan group.
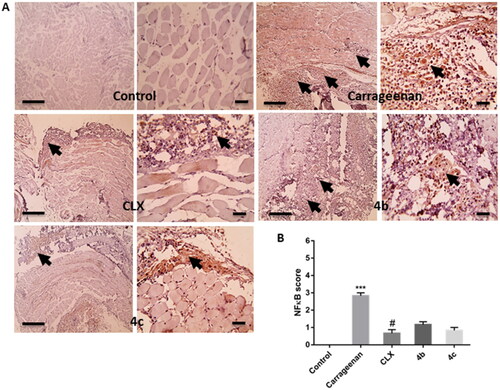
Figure 9. (A) Representative images of immunostained paw sections showing COX-2 positive expression (arrows). (B) Semi-quantitative scoring of COX-2 positive expression. *** p < 0.001 compared to the control group; # p < 0.05, ## P < 0.01 compared to the carrageenan group.
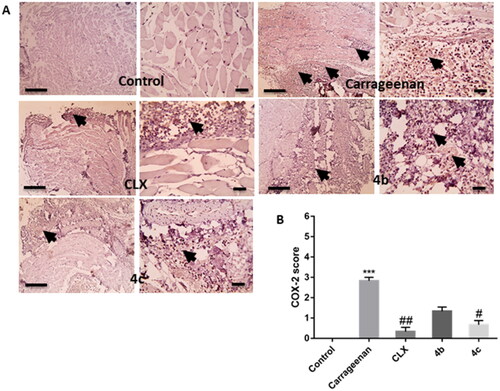
Figure 10. Effects of Celecoxib (CLX), 4 b, and 4c on carrageenan-induced elevation of (A) Prostaglandin E2 (PGE2) and (B) Tumour necrosis factor-alpha (TNF-α) paw tissue levels. *** p < 0.001 compared to the control group; # p < 0.05, ### P < 0.001 compared to the carrageenan group; $$p < 0.01, $$$P < 0.001 compared to the CLX group; + p < 0.05 compared to the 4 b group.
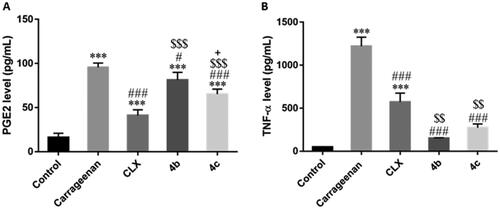
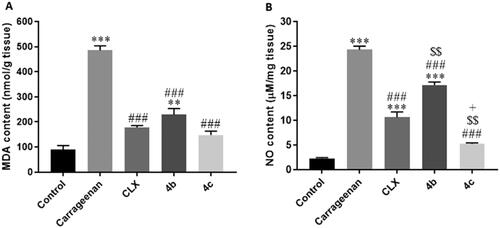
Figure 11. Effects of Celecoxib (CLX), 4 b, and 4c on carrageenan-induced elevation of (A) malondialdehyde (MDA) and (B) Nitric oxide (NO) paw tissue contents. ** p < 0.01, *** p < 0.001 compared to the control group; # p < 0.05, ### P < 0.001 compared to the carrageenan group; $$p < 0.01 compared to the CLX group; + p < 0.05 compared to the 4 b group.