Figures & data
Figure 1. GSK126 and JQ1 combined treatment reduces cell viability, cell proliferation, and clonogenic ability of metastatic PC cells. DU145 (A) and PC3 (B) cell lines were treated for 48h with GSK126 IC50 doses in the absence or presence of increasing concentrations of JQ1 as indicated. Cell viability was determined by the ATPlite assay and expressed as percentage of the control. Data represent the mean ± SEM of three independent experiments. (C–E) Analysis of cell viability in DU145, PC3, and LNCaP cells treated with GSK126 and JQ1 alone or in combination (at the fixed concentration ratio of 30:1 for DU145 and 20:1 for PC3 and LNCaP) for 48h. The results are reported as percentage of the control and represent the mean ± SD of the two independent experiments performed in triplicate. *Adjusted p < 0.05 indicates significant differences vs. control (CTR); § adjusted p < 0.05 indicates significant differences vs. JQ1; # adjusted p < 0.05 indicates significant differences vs. GSK126 (One-way ANOVA followed by multiple t-test with Bonferroni correction). (F–H) Calculation of the combination index (CI). The results represent the mean of two independent experiments performed in triplicate. On the y axis is represented the combination index, on the x axis the fraction of cells inhibited. CI values of <1, =1, and >1 indicate synergistic, additive, and antagonistic effects, respectively. DU145 (I) and PC3 (J) cell proliferation was determined by crystal violet assay after 48h of treatment with GSK126 or JQ1 and with the two drugs in combination at the concentrations reported in the figure (fixed concentration ratio of 30:1 for DU145 and 20:1 for PC3). DU145 (K) and PC3 (L) colony formation ability was determined by clonogenic assay after 9 days of treatment with GSK126 and JQ1 alone or in combination at the concentrations reported in the figure (fixed concentration ratio of 30:1 for DU145 and 20:1 for PC3). Images are representative of two independent experiments.
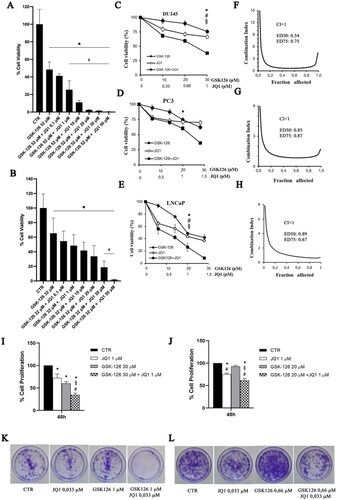
Figure 2. Effects of GSK126 and JQ1 combined treatment on EZH2, BRD4, and their molecular targets. BRD4, EZH2, NF-kB, c-myc, and H3K27me3 protein expression was evaluated by western blot analysis in DU145 (A) and PC3 (B) after 72h of treatment with GSK126 or JQ1 and with the two drugs in combination as indicated. β-actin was used as the loading control. Immunoreactive bands were quantified by densitometric analysis and normalised to β-actin signal. The normalised densitometric data reported in the bar graphs are expressed as percentage of the control and represent the mean ± SEM of three independent experiments. *Adjusted p < 0.05 indicates significant differences vs. CTR; § adjusted p < 0.05 indicates significant differences vs. JQ1; # adjusted p < 0.05 indicates significant differences vs. GSK126 (one-way ANOVA followed by multiple t-test with Bonferroni correction).
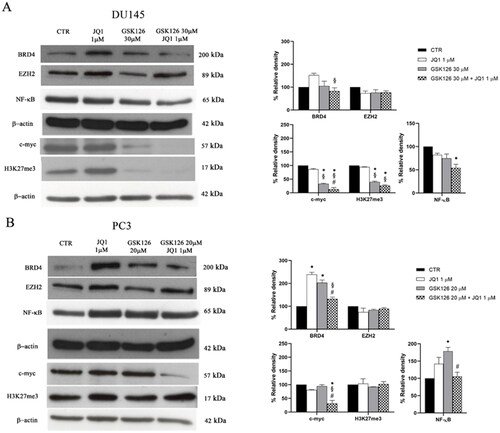
Figure 3. Effects of GSK126 and JQ1 combined treatment on cell death, apoptosis and cell cycle progression. After 48 h and 72 h of treatment with GSK126 or JQ1 and with the two drugs in combination at the concentration indicated in the figure, cell dead was determined by Live/Dead assay in DU145 (A) and PC3 (B) and reported in the bar graph as percentage of the control. Apoptosis was determined by Annexin V/PI double staining in DU145 (C) and PC3 (D) and reported in the bar graph as percentage of the control. On the Y-axis is reported the sum of Annexin V-positive cells plus Annexin V/PI positive cells. The percentage of cells distribution in the cell cycle phases was determined in DU145 (E) and PC3 (F) by FxCycle™ PI/Rnase staining. Data represent the mean ± SEM of three independent experiments. *Adjusted p < 0.05 indicates significant difference vs. CTR; § adjusted p < 0.05 indicates significant difference vs. JQ1; # adjusted p < 0.05 indicates significant difference vs. GSK126 (one-way ANOVA followed by multiple t-test with Bonferroni correction).
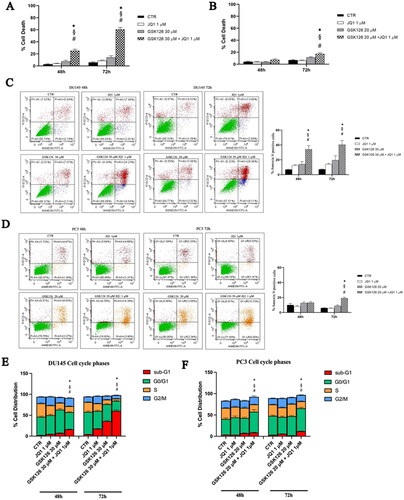
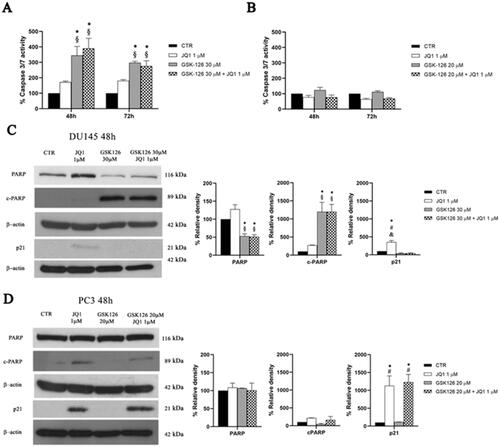
Figure 4. Analysis of cell death mechanisms induced by GSK126 and JQ1 combined treatments. Percentage of DU145 (A) and PC3 (B) caspase3/7 activity was determined by Caspase-Glo® 3/7 assay after 48 h and 72 h of treatment GSK126 or JQ1 and with the two drugs in combination as indicated. The measure of the enzymatic activity measured after the treatments has been reported in the bar graphs as percentage of the control. Data are the mean ± SEM of three independent experiments. *Adjusted p < 0.05 indicates significant difference vs. CTR; § adjusted p < 0.05 indicates significant difference vs. JQ1 (one-way ANOVA followed by multiple t-test with Bonferroni correction). PARP, cPARP, and p21 protein expression was evaluated by western blot analysis in DU145 (C) and PC3 (D) after 48h of treatment with GSK126 or JQ1 and with the two drugs in combination as indicated. β-actin was used as the loading control. The expression levels of PARP, cPARP, and p21 was measured by densitometric analysis and normalised to β-actin. The normalised densitometric data reported in the bar graphs are expressed as percentage of the control and represent the mean ± SEM of three independent experiments. * Adjusted p < 0.05 indicates significant differences vs. CTR; § adjusted p < 0.05 indicates significant differences vs. JQ1; # adjusted p < 0.05 indicates significant differences vs. GSK126 (one-way ANOVA followed by multiple t-test with Bonferroni correction).