Figures & data
Figure 1. Structures of Osimertinib (AZD-9291), Sunitinib (SU11248), approved anticancer drugs, and some previously reported penta-heterocycles scaffold as antiproliferative agents (Compound A, B and C).
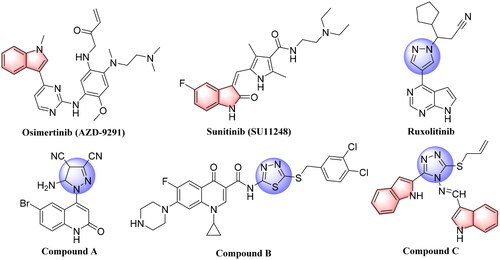
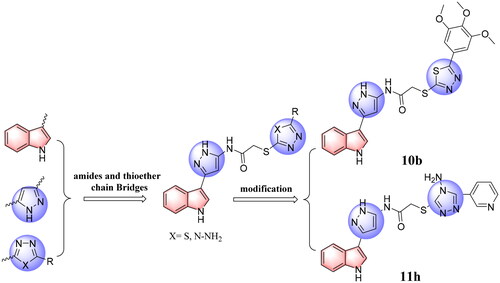
Figure 2. The design strategy of the target compounds in this study, and the resulting most active antitumor candidates (10 b and 11 h).
Scheme 1 Synthetic route for the title compounds 10a–i and 11a–r.
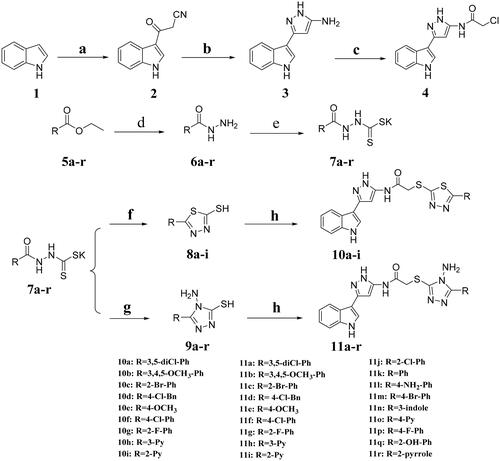
Table 1. Antiproliferative activity of the synthesised compounds 10a–i and 11a–r a.
Table 2. The selectivity index for the compounds 10 b and 11 h.
Figure 3. The fluorescence microscopy images of A549 cells after DAPI staining. A549 cells treated with compound 10 b at 1, 2 and 4 μM for 48 h. Arrows indicated signs of nuclear shrinkage and chromatin condensation, the scar bar is 100 μm. And the apoptosis analysis through annexin V-FITC/PI double staining and following flow cytometry for the A549 cells treated with compound 10 b at 1, 2 and 4 μM for 48 h. DMSO was the negative control, as 5-Fu was the reference drug. (A) Control, (B) 10 b (1 μM), (C) 10 b (2 μM), (D) 10 b (4 μM) and (E) 5-Fu (4 μM). (F) The percentage of apoptosis cells was quantified in the segments of the bar chart. Three individual experiments were performed for each group. Data are expressed as the mean ± SD of three independent experiments. ***p < 0.005.
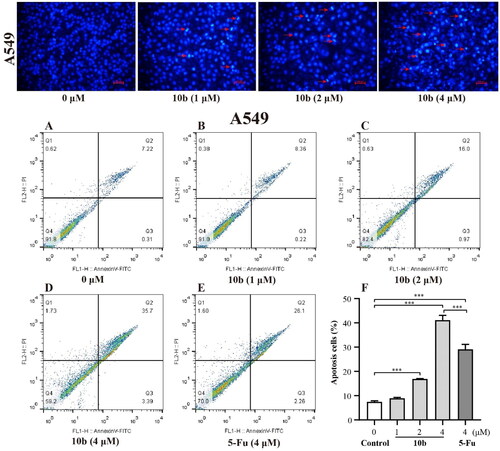
Figure 4. Apoptosis analysis through annexin V-FITC/PI double staining and following flow cytometry for the K562 cells treated with compound 10 b at 1, 2 and 4 μM for 48 h. DMSO was the negative control, as 5-Fu was the reference drug. (A) Control, (B) 10 b (1 μM), (C) 10 b (2 μM), (D) 10 b (4 μM) and (E) 5-Fu (4 μM). (F) The percentage of apoptosis cells was quantified in the segments of the bar chart. Three individual experiments were performed for each group. Data are expressed as the mean ± SD of three independent experiments. ***p < 0.005.
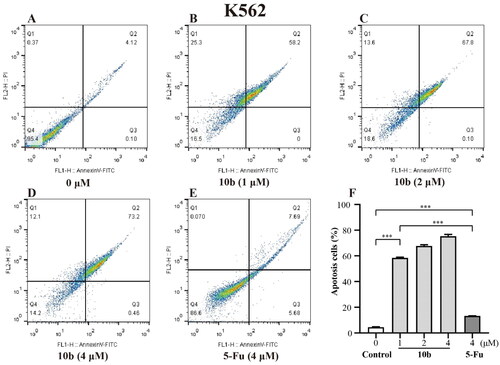
Figure 5. Cell cycle analysis through PI staining and following flow cytometry for the A549 cells treated with compound 10 b at 1, 2 and 4 μM for 24 h. DMSO was the negative control, as 5-Fu was the reference drug. (A) Control, (B) 10 b (1 μM), (C) 10 b (2 μM), (D) 10 b (4 μM) and (E) 5-Fu (4 μM). (F) The proportion of the cell cycle was quantified in the segments of the bar chart. Three individual experiments were performed for each group. Data are expressed as the mean ± SD of three independent experiments. ***p < 0.005.
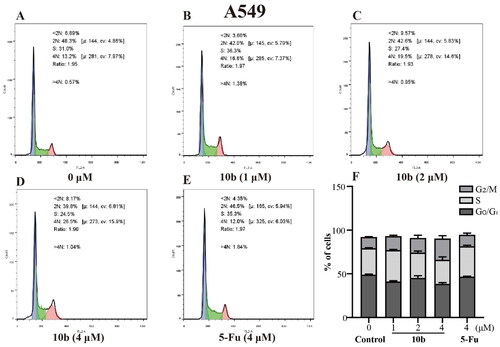
Figure 6. Cell cycle analysis through PI staining and following flow cytometry for the K562 cells treated with compound 10 b at 1, 2 and 4 μM for 24 h. DMSO was the negative control, as 5-Fu was the reference drug. (A) Control, (B) 10 b (1 μM), (C) 10 b (2 μM), (D) 10 b (4 μM) and (E) 5-Fu (4 μM). (F) The proportion of the cell cycle was quantified in the segments of the bar chart. Three individual experiments were performed for each group. Data are expressed as the mean ± SD of three independent experiments. ***p < 0.005.
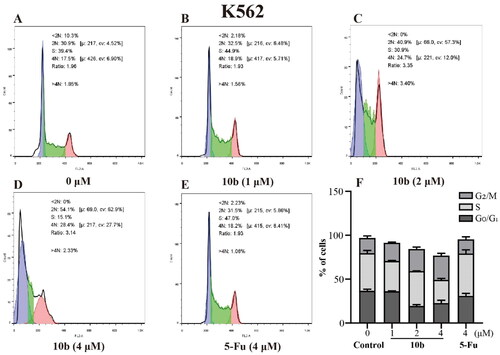
Figure 7. Cell migration and invasion assay carried out in A549 after 12 and 24 h of 1 μM 10 b or 5-Fu treatment. (A) Representative images of wound healing migration assay; (B) Semi-quantitative analysis of migration cells at non-covered area. The scar bar is 100 μm. Three individual experiments were performed for each group. Data are expressed as the mean ± SD of three independent experiments. ***p < 0.005.
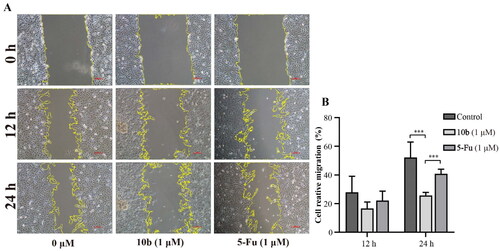
Figure 8. Western blot analysis of proteins obtained from cells treated with compound 10 b at 0.5 and 1 μM for 48 h. DMSO was the negative control, as 5-Fu was the reference drug. (A) Western blotting analysis of EGFR, p-EGFR, Akt and p-Akt levels in A549. (B) Average fold change of EGFR, p-EGFR, Akt and p-Akt with respect to the housekeeping gene GAPDH in different treatment groups following densitometric analysis. (C) Western blotting analysis of MDM2 and p53 levels in K562. (D) Average fold change of MDM2 and p53 with respect to the housekeeping gene GAPDH in different treatment groups following densitometric analysis. Three individual experiments were performed for each group. Data are expressed as the mean ± SD of three independent experiments. ***p < 0.005.
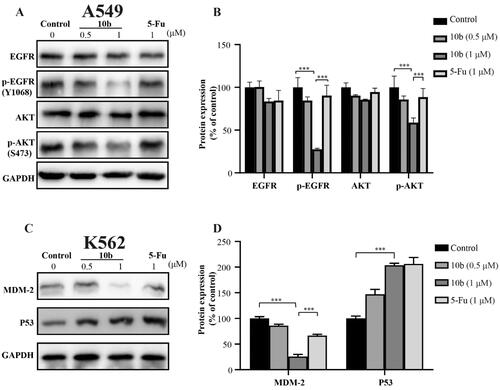
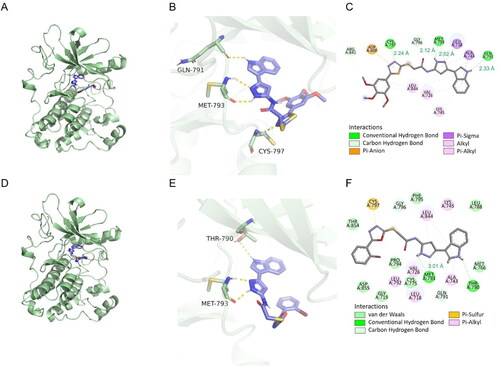
Figure 9. The docking results were analysed visually and binding interactions of compounds 10 b and 11 h into EGFR. (A, D) Cartoon like representation showing the co-crystallized Gefitinib into EGFR of compound 10 b and 11 h. (B, E) 3 D binding mode of compound 10 b and 11 h into the active site of EGFR. (C, F) 2 D binding mode of compound 10 b and 11 h in the active site EGFR.