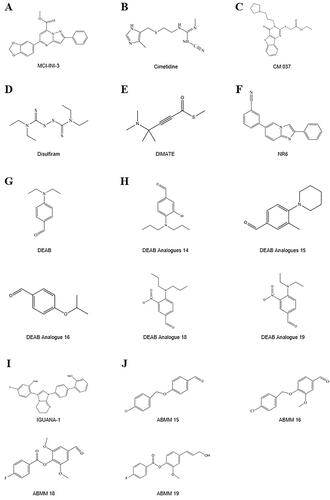
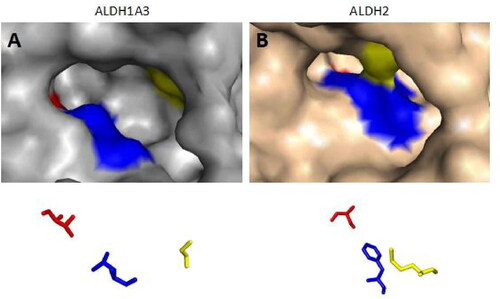
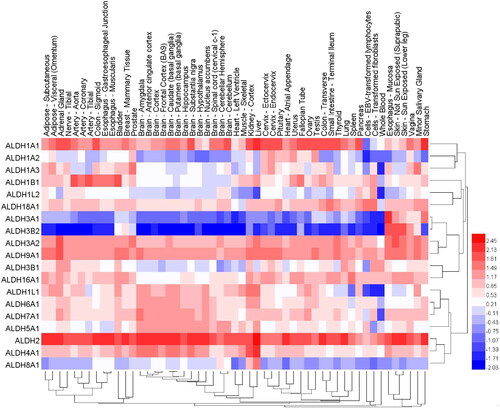
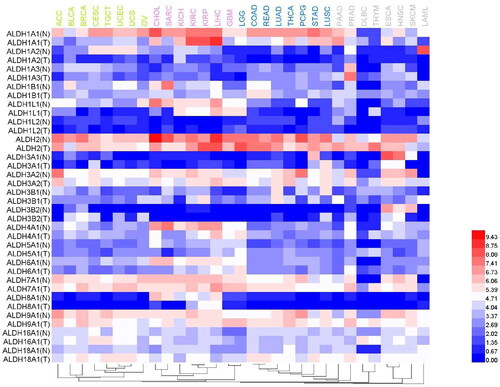
2,022
Views
3
CrossRef citations to date
0
Altmetric
Review

ALDEFLUOR activity, ALDH isoforms, and their clinical significance in cancers

, , &
Article: 2166035 | Received 31 Aug 2022, Accepted 03 Jan 2023, Published online: 18 Jan 2023

Figures & data

Figure 1. Chemical structures of ALDH inhibitors.

Figure 1. Chemical structures of ALDH inhibitors.

Table 1. Different ALDH isoforms and their location in various cancer types.

Figure 2. The substrate binding positions of ALDH1A3 and ALDH2. Surface representation of ALDH1A3 (A, in gray); the conserved ligand-binding residues are occupied by G136, L471, and T315 (PDB:5FHZ). Surface representation of human mitochondrial ALDH2 (B, in pink), with positions 124, 459, and 303 shown (PDB:1O01). The binding sites from the two monomers are shown as sticks and coloured red, blue, and yellow according to their positions.

Figure 2. The substrate binding positions of ALDH1A3 and ALDH2. Surface representation of ALDH1A3 (A, in gray); the conserved ligand-binding residues are occupied by G136, L471, and T315 (PDB:5FHZ). Surface representation of human mitochondrial ALDH2 (B, in pink), with positions 124, 459, and 303 shown (PDB:1O01). The binding sites from the two monomers are shown as sticks and coloured red, blue, and yellow according to their positions.

Figure 3. The expression levels of different ALDH family isoforms in 30 normal tissues. The data were derived from the GTEx (Genotype-Tissue Expression Project). Dendrograms and heat maps of ALDH mRNA expression in various normal tissues are shown.

Figure 3. The expression levels of different ALDH family isoforms in 30 normal tissues. The data were derived from the GTEx (Genotype-Tissue Expression Project). Dendrograms and heat maps of ALDH mRNA expression in various normal tissues are shown.

Figure 4. Comparison of the expression levels of different ALDH subtypes in various tumour tissues and corresponding normal tissues. A heat map was generated based on a TCGA dataset. The dendrogram of tumours (top) was divided into 4 parts using different colours.

Figure 4. Comparison of the expression levels of different ALDH subtypes in various tumour tissues and corresponding normal tissues. A heat map was generated based on a TCGA dataset. The dendrogram of tumours (top) was divided into 4 parts using different colours.

Table 2. Clinical trials on ALDH in cancers.

Data availability and materials

The materials that support the conclusions of this review have been included within the article.