
Figures & data
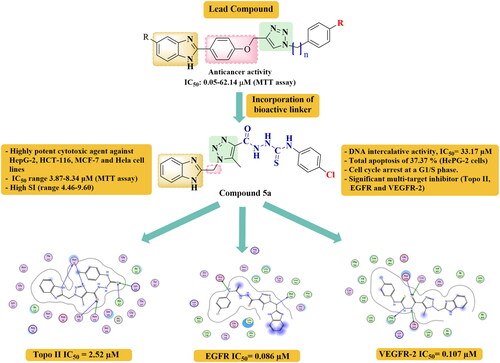
Figure 1. Reported 2-substituted benzimidazoles as multi-target enzyme inhibitors.

Figure 2. Reported 1,2,3-triazole scaffolds as multi-target enzyme inhibitors.

Figure 3. Rational design of the newly synthesised benzimidazole-triazole hybrids.

Scheme 1. Reagents and conditions: (a) DMSO, stirring, rt, 15 h, (b) EAA, K2CO3, DMSO, stirring, rt, overnight, (c) NH2NH2.H2O, EtOH, stirring, rt, overnight, (d) THF, stirring, rt, (e) EtOH, AcOH, reflux

Table 1. IC50 values (µM) of target compounds 5a-h and 6a-g against four cancer cell lines in comparison with Dox.
Table 2. In vitro cytotoxic study of the most active compounds 5a and 6g against WI-38 cell line and their selectivity indexes.
Table 3. In vitro EGFR-2, VEGFR-2, and Topo II inhibitory effects of the synthesised compounds 5a and 6g compared to reference drugs.
Table 4. DNA binding assay results (IC50, µM) of compounds 5a and 6g.
Figure 4. Flow cytometry analysis of DNA ploidy in HepG-2 cells after treatment with compounds 5a and 6g.

Table 5. Effect of compounds 5a and 6g on the cell cycle distribution in HepG-2 cells.
Figure 5. Effect of compounds 5a and 6g on the percentage of Annexin V-FITC-positive staining in HepG-2 cells. The cells were treated with DMSO as a control, 5a and 6g for 24 h. Q1: Necrotic cells, Q2: Late apoptosis, Q3: Live cells, Q4: early apoptosis.

Figure 6. Early, late, total apoptosis, and necrosis induced by compounds 5a and 6g in HepG-2 cells compared to control.

Table 6. Apoptosis and necrosis induction analysis in HepG-2 cells after treatment with compounds 5a and 6g.
Table 7. The binding energy of compound 5a and 6g in comparison to the co-crystallised ligand for each prospective target.
Figure 7. (a) 2D interaction of compound 5a with Topo II active site (PDB code: 1ZXM). (b) Aligned conformation of compound 5a (Green) with co-crystallised ligand (Salmon) inside Topo II.

Figure 8. (a) 2D interaction of compound 6g with Topo II active site (PDB code: 1ZXM). (b) Aligned conformation of compound 6g (Red) with co-crystallised ligand (Salmon) inside Topo II.

Figure 9. (a) 2D interaction of compound 5a with VEGFR-2 active site (PDB code: 2OH4). (b) Aligned conformation of compound 5a (Green) with co-crystallised ligand (Cyan) inside VEGFR-2.

Figure 10. (a) 2D interaction of compound 6g with VEGFR-2 active site (PDB code: 2OH4). (b) Aligned conformation of compound 6g (Red) with co-crystallised ligand (Cyan) inside VEGFR-2.

Figure 11. (a) 2D interaction of compound 5a with EGFR active site (PDB code: 2J6M). (b) Aligned conformation of compound 5a (Green) with co-crystallised ligand (Magenta) inside EGFR.

Figure 12. (a) 2D interaction of compound 6g with EGFR active site (PDB code: 2J6M). (b) Aligned conformation of compound 6g (Red) with co-crystallised ligand (Magenta) inside EGFR active site.

Table 8. Calculated Lipinski’s rule of five for compound 5a, 6g, Dox, Sorafenib, and Gefitinib.
Figure 13. Bioavailability radar plot for compounds 5a, 6g, Dox, Sorafenib, and Gefitinib.
