
Figures & data
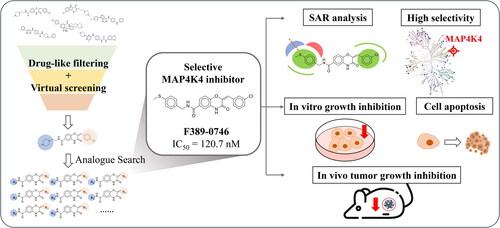
Figure 1. Workflow of identifying novel MAP4K4 inhibitors. (A) Steps of screening strategy. (B) In vitro and in vivo validation of potential MAP4K4 inhibitors.

Table 1. Inhibitory percentage of potential MAP4K4 inhibitors.
Figure 2. Interaction analysis of compound F389-0746. (A) Binding pose of compound F389-0746 in the MAP4K4 binding site. The dashed lines denote hydrogen bonds. The docking pose was generated by Pymol. (B) The 2D representation of compound F389-0746 docked in the MAP4K4 binding site showed hydrophobic interactions and hydrogen bonds. The dashed line denotes hydrogen bonds, and the solid line denotes hydrophobic interactions. 2D representation was created in LeadIT.

Table 2. Inhibitory percentage of F389-0167 analogues.
Table 3. IC50 values of potent MAP4K4 inhibitors.
Figure 3. SAR analysis of F389-0746 and its analogues. (A) Favourable and unfavourable sites of interactions, including negative electrostatics, positive electrostatics , favourable hydrophobic, and unfavourable hydrophobic. (B–C) Two favourable hydrophobic sites. (D) Unfavourable hydrophobic site. (E) Negative electrostatics site. The dotted circle demonstrated the difference between the analogues and may influence the activity.

Figure 4. Selectivity profiling of F389-0746. (A) Inhibitory activity of F389-0746 on a panel of 81 kinases across the kinome. (B) A kinome tree composed of seven superfamilies showing the kinase inhibitory activity. The compound was tested at 150 nM. The big and the small circles represent > 50% and < 50% of inhibitions, respectively.

Figure 5. Inhibitory effects of F389-0746 on pancreatic cancer cell lines. Cell viability inhibitory effect for (A) Panc-1 and (B) AsPC-1 cells. Cell growth inhibitory effect for (C) Panc-1 and (D) AsPC-1 cells. Both cell lines were treated with 1, 3, 10, and 30 µM F389-0746 for 72 and 96 h. Results are shown as the mean ± SD from three independent experiments. Statistical significance was calculated using Student’s t-test. *p < 0.05, **p < 0.01, ***p < 0.001 versus the control group.

Figure 6. Apoptosis induction of MAP4K4 inhibitor F389-0746 in Panc-1 and AsPC-1 cells. Cell cycle distribution of (A) Panc-1 and (B) AsPC-1 cells. Percentages of SubG1 cells of (C) Panc-1 and (D) AsPC-1 cells. Both cell lines were treated with vehicles, 3, 10, and 30 μM F389-0746 for 24, 48, and 72 h. The cell cycle distribution was analysed using flow cytometry.

Figure 7. Inhibitory effects of F389-0746 on MAP4K4 downstream phosphorylation and the induction of apoptotic markers. Influence on MAP4K4 downstream phosphorylation and apoptotic markers of (A) Panc-1 and (B) AsPC-1 cells. Both cell lines were treated with F389-0746 at a concentration of 3, 10, and 30 μM for 24, 48, and 72 h.

Figure 8. Tumour growth inhibition after F389-0746 treatment in vivo. (A) Tumour volume (B) Body weight. The control group was administered with the vehicle, the positive control group was administered with 100 mg/kg of gemcitabine, and the treatment group was administered with 200 mg/kg of F389-0746. Tumour growth inhibition (%) was calculated and compared with the control group. Results are shown as the mean ± SEM. Statistical significance was calculated using Student’s t-test. *p < 0.05 versus the control group.
