Figures & data
Figure 1. Graphical illustration of Pim1 kinase role during the cell cycle G1/S phase.
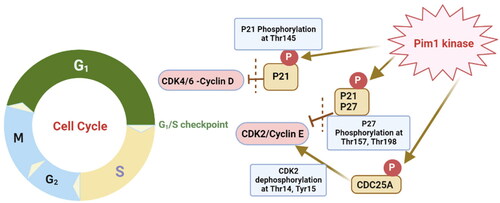
Figure 2. The protein crystal structure of Pim1 kinase (PDB ID: 4DTK) with a focus on the binding site residues.
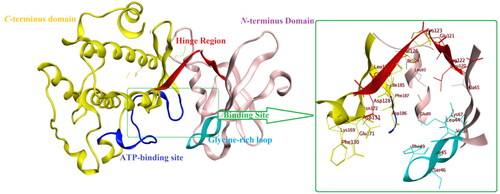
Figure 3. Reported thiazole, thiazolidinedione and bis-thiazole derivatives with anticancer activity.
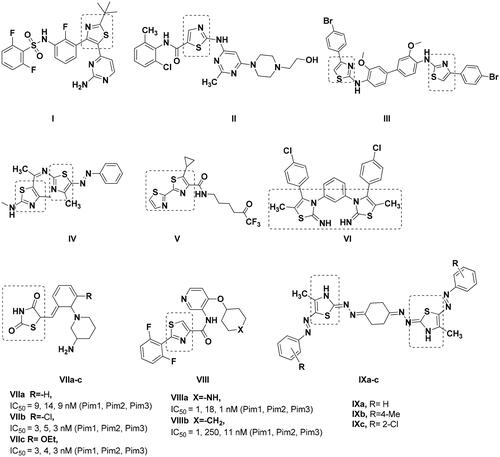
Figure 4. Schematic presentation of the study rationale.
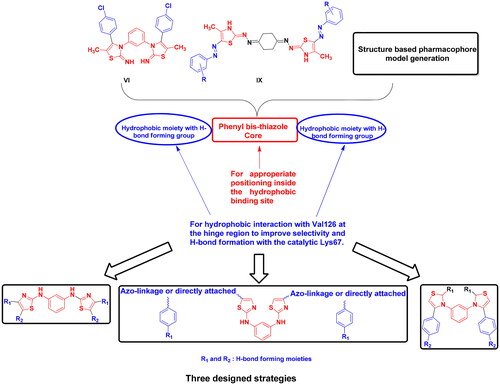
Figure 5. Schematic presentation of the study workflow.
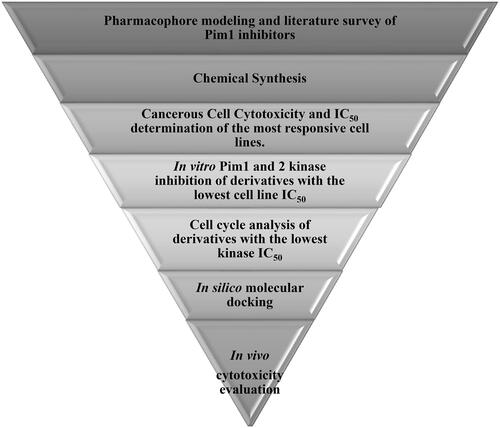
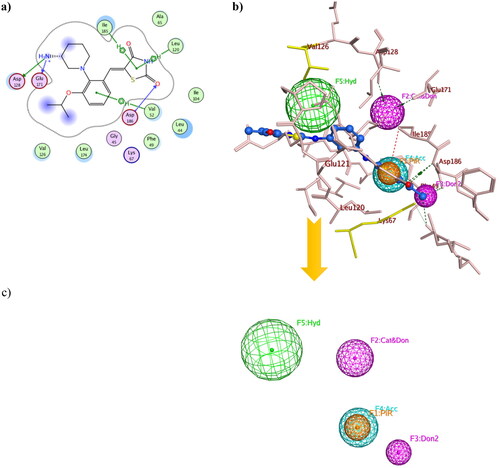
Figure 6. Three-dimensional presentation of the structure based pharmacophore model using PDB: 4DTK where (a) showed the 2D interaction of 7LI inside the active site (b) showed 7LI-Pim1 interaction pattern with its pharmacophore features while (c) was the calculated model.
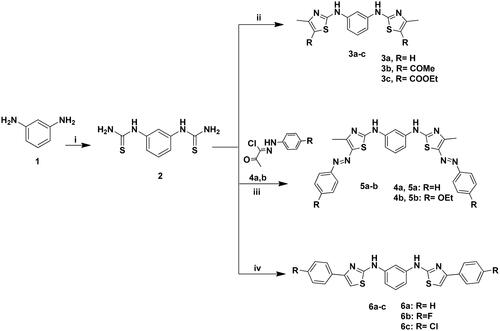
Scheme 1. Synthesis of 3a–c, 5a–b and 6a–c; Reagents and conditions: (i) NH4SCN (3eq.), H2O, HCl, reflux, 6 h; (ii) CH3COCHClR (2eq.), EtOH, TEA, reflux, 8–12 h; (iii) 4a–b (2eq.), EtOH, TEA; (iv) 2-chloro-1-phenylethanone derivative (2eq.), EtOH, TEA, reflux, 24 h.
Scheme 2. Synthesis of 8a–c and 9; Reagents and conditions: (i) PhNCS (2 eq.), EtOH, reflux, 2 h; (ii) 2-chloro-1-phenylethanone derivative (2 eq.), EtOH, TEA, reflux, 24 h; (iii) CH3COCHClCOCH3 (2eq.), EtOH, TEA, reflux, 24 h.
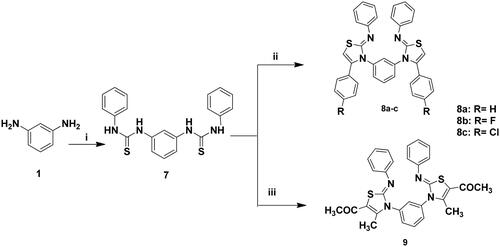
Figure 7. Growth inhibition percentage of 3b, 5a, 6a–b and 8b using breast, non-small cell lung cancer cell lines (a), renal, leukaemia and ovarian cancer cell lines (b) at single concentration of 10 μM.
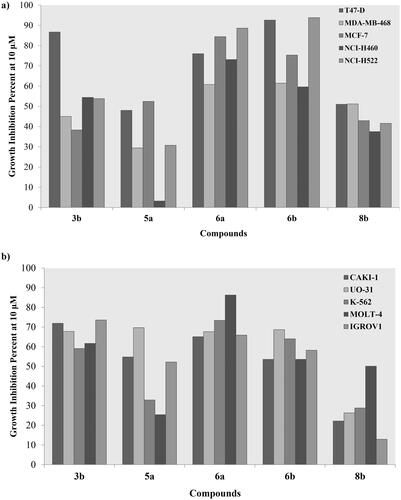
Table 1. Breast cancer T47D cell line IC50 values of 3a–b, 5a, 6a–c and 8b in μM at 48 h and 96 h incubation intervals and normal epithelia breast cell line IC50 of 3b and 8b in μM at 48 h using staurosporine as reference with the lowest values were highlighted in bold.
Table 2. Pim1 and Pim2 kinase IC50 values of 3b, 6a–b and 8b in μM with the lowest values were highlighted in bold.
Figure 8. The effect of 3b and 8b on cell cycle distribution of the breast cancer T47D cell line after 48 h incubation.
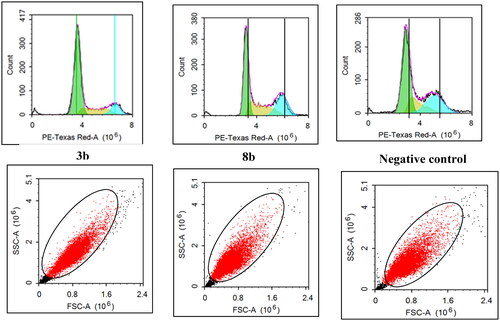
Figure 9. The percentage of cells that accumulate at each stage of breast cancer T47D cell line development was shown in a bar chart. All data are shown as the mean of three independent experiments ± standard deviation. One-way ANOVA test followed by Tukey’s post-hoc test at (p < 0.05) was used for statistical analysis.
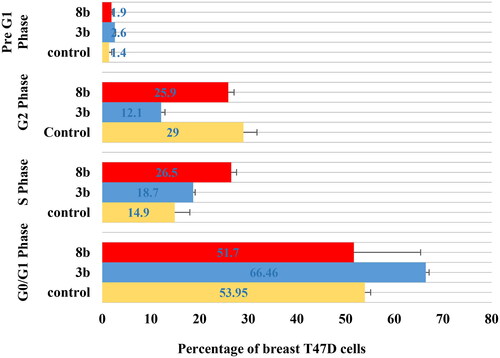
Figure 10. The 2D and 3D representations of molecular interactions of 3b (a,b) as green stick model with Pim-1 kinase using PDB 4DTK where the conserved Lys67 at the active site and Val126 were highlighted as yellow stick model. The 3D representations highlighted the formed hydrogen bonds and H-pi interactions as blue and green dotted lines, respectively with their corresponding distance in Å.
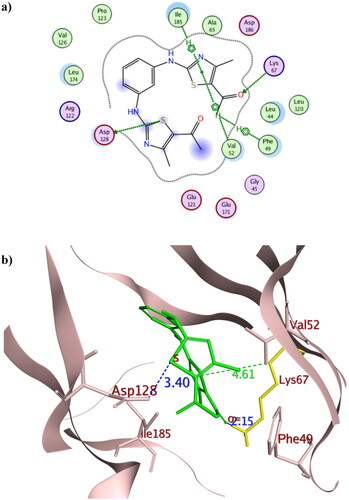
Figure 11. The 2D and 3D representations of molecular interactions of 8b (a, b) as green stick model with Pim-1 kinase using PDB 4DTK where the conserved Lys67 at the active site and Val126 were highlighted as yellow stick model. The 3D representations highlighted the formed hydrogen bonds and H-pi interactions as blue and green dotted lines, respectively with their corresponding distance in Å. The position of the suggested orientation of 8b relative to the co-crystallised ligand 7LI was illustrated inside the full kinase protein structure in (c) mentioning the important kinase fragments.
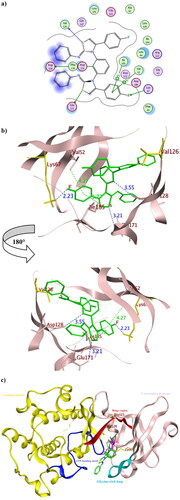
Table 3. The pharmacophore RMSD and molecular docking results of 3b and 8b using Pim1 kinase PDB: 4DTK with the crucial amino acids in bold.
Figure 12. The 2D presentations of the molecular docking of 3b (a), 8b (b) and the co-crystallised ligand 3YR (c) using Pim2 kinase PDB 4X7Q.
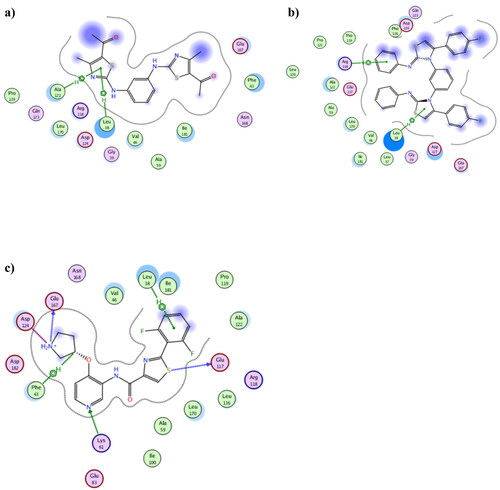
Figure 13. H&E-stained sections of Ehrlich solid tumour tissue (×200). (a) Untreated control demonstrated extensive tumour cell infiltration between individual muscle fibres. (b) Doxorubicin exposed small clusters of cancerous cells. (c) 8b showed minimal infiltration of neoplastic cells and a significant reduction in their quantity. (d) 3b displayed aggregates of neoplastic cells with their typical structure that surrounded by small patches of necrotic muscle tissue.
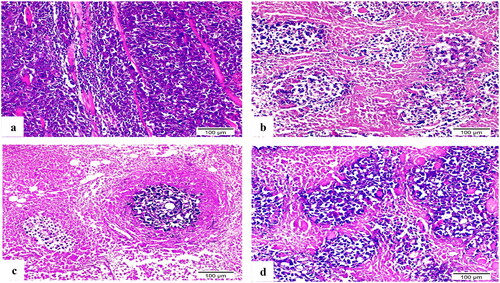
Figure 14. Sections of Ehrlich solid tumour tissue immunohistochemically labelled for caspase-3 (×200). (a) Untreated control lacking detectable antibody for caspase-3. (b) DOX with positive caspase3 immunoreactivity. (c) 8b exhibited significant positive expression of caspase-3 by the immune system. (d) 3b displayed positive caspase-3 immunoreactivity.
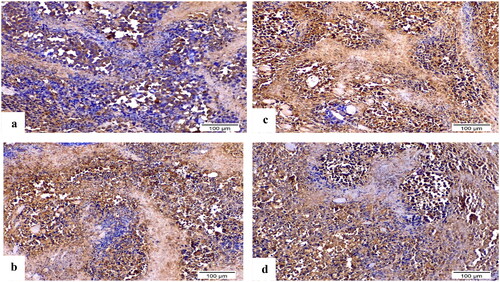
Figure 15. Sections of Ehrlich solid tumour tissue immunohistochemically labelled for VEGF (×200). (a) The untreated control demonstrates high VEGF immunoreactivity. (b) DOX immunoreactivity for VEGF was moderate. (c) 8b revealed no appreciable VEGF immunoreactivity. (d) 3b indicated moderate VEGF positivity in the epidermal growth factor receptor.

Figure 16. Graphical presentation of VEGF and caspase-3 immunostaining as well as their percentage area in experimental groups. The data were presented as a mean SD (n = 6) and analysed using one-way ANOVA followed by Tukey’s post-hoc test with a significance level of p = 0.05. Significantly distinct from the positive control group, the DOX group, the 8b group, and the 3b group. Significantly distinct from the 8b group. +ve: untreated control group.
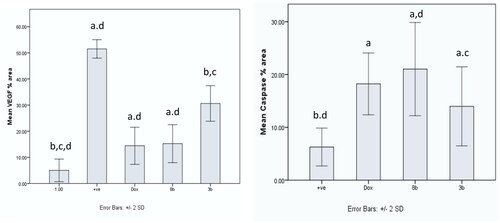
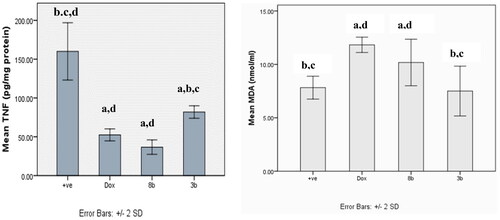
Figure 17. The effect of compounds 8b and 3b compared to doxorubicin on levels of TNF-α and MDA serum level in in experimental mice. All tested groups were implanted with Ehrlich solid tumour then treated with vehicle only (positive control), DOX, 8b, or 3b. The results were shown as mean SD and evaluated using one-way ANOVA followed by Tukey’s post-hoc test at a significance level of p = 0.05 (n = 6). Significantly distinct from the positive control group, DOX group, 8b group, and 3b group. Significantly distinct from the 8b group.