
Figures & data
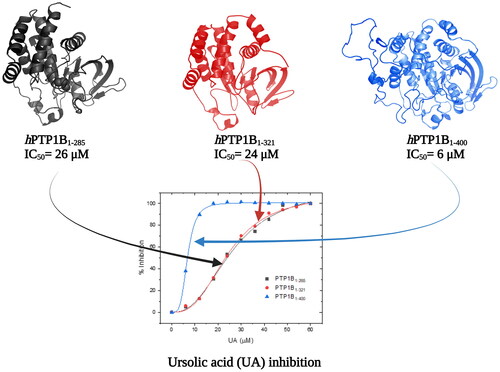
Figure 1. Structural domains of full-length PTP1B. The complete structure of hPTP1B is made up of an N-terminal catalytic domain (PTP1B1-300), an intrinsically disordered regulatory domain (PTP1B301-400), and a C-terminal ER localising domain (PTP1B401-435).
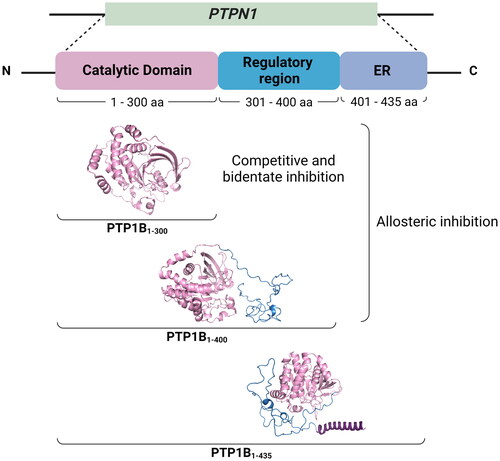
Figure 2. Main metabolic signalling pathways modulated by PTP1B. PTP1B acts as a negative regulator of insulin and leptin signalling pathways. In the insulin pathway, PTP1B dephosphorylates tyrosine residues in IR, IRS-1 and IRS-2, supporting glucose homeostasis by modulating GLUT4 transit. In the leptin signalling pathway, PTP1B dephosphorylates LepRb and JAK2, inactivating STAT3 and thus controlling the expression of genes POMC and SOCS3 involved in energy balance. Abbreviatures: ADP: adenosine diphosphate. ATP: adenosine triphosphate. Akt: Ak strain transforming. AS160: Akt substrate of 160 kDa. ER: endoplasmic reticulum. GLUT4: glucose transporter type 4. GSV: glucose storage vesicles. IR: insulin receptor. IRK: tyrosine kinase domain of the insulin receptor. IRS-1/2: insulin receptor substrate ½. JAK2: Janus kinase 2. LepRb: short isoform of the leptin receptor. mTORC2: mammalian/mechanistic target of rapamycin (mTOR) complex 2. PDK1: phosphatidylinositol-dependent kinase 1. PH: pleckstrin homology domain. PI3K: Phosphoinositide 3-kinases. PIP2: Phosphatidylinositol 4,5-bisphosphate. PIP3: phosphatidylinositol 3,4,5 trisphosphate. POMC: proopiomelanocortin. PTEN: phosphatase and tensin homolog. PTP1B: protein tyrosine phosphatase 1B. pY: phosphotyrosine. Ras: rat sarcoma virus. SOCS3: suppressor of cytokine signalling 3. STAT3: signal transducer and activator of transcription 3.
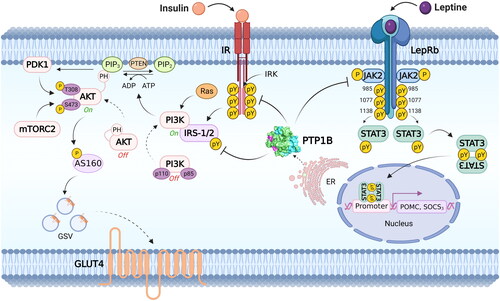
Figure 3. Recombinant hPTP1B purification process steps. (A) Fractions containing hPTP1B1-400 (22–26) collected during the HisTrap HP chromatography purification process. (B) SDS-PAGE (12%) electrophoresis gel band pattern shows the molecular weight of the three hPTP1B constructs: ∼33 kDa for hPTP1B1-285 (lane 2), ∼37 kDa for hPTP1B1-321 (lane 3), and ∼45 kDa for hPTP1B1-400 (lane 4).
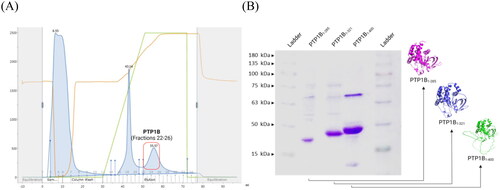
Figure 4. Inhibition assay using three constructs of the hPTP1B enzyme. (A) Chlorogenic acid (CGA). (B) Ursolic acid (UA). (C) Suramin (SUR). These inhibition assays were performed in a final volume of 100 μL of Tris 50 mM, DTT 0.25 uM, pH 6.8. hPTP1B constructs (hPTP1B1-285, hPTP1B1-321, and hPTP1B1-400) (66 nM) were incubated with ten increasing concentrations of each inhibitor at 37 °C for 15 minutes. Assay solutions (hPTP1B constructs + assay buffer) without inhibitors were used as a negative control. The absorbance was measured at 405 nm. Data are representative of three independent experiments.
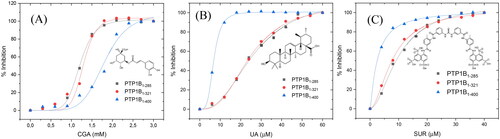
Table 1. Inhibition parameters of CGA, UA and SUR compounds using the three PTP1B constructs.
Table 2. Previously reported inhibition and kinetic parameters using short and full PTP1B constructs.
Figure 5. Enzyme kinetics of hPTP1B1-400 inhibition. Linweaver–Burk plots show the inhibition mechanism of tested compounds on hPTP1B1-400. (A) Chlorogenic acid. (B) Ursolic acid. (C) Suramin. (D) Sodium orthovanadate. (E) Glycyrrhetinic acid derivatives Compound 5b. The plots represent the reciprocal of the reaction velocity (1/V) as a function of the reciprocal of the pNPP concentration (1/[pNPP]). Data are representative of three independent experiments. The inhibitory mechanism for each compound was determined by fitting data to the equations defined for competitive, mixed, and uncompetitive inhibition models. Data represented in the graphs correspond to the best fit to each inhibition model (based on the R2 coefficient) (OriginPro 2018 (64-bit). SR1).
![Figure 5. Enzyme kinetics of hPTP1B1-400 inhibition. Linweaver–Burk plots show the inhibition mechanism of tested compounds on hPTP1B1-400. (A) Chlorogenic acid. (B) Ursolic acid. (C) Suramin. (D) Sodium orthovanadate. (E) Glycyrrhetinic acid derivatives Compound 5b. The plots represent the reciprocal of the reaction velocity (1/V) as a function of the reciprocal of the pNPP concentration (1/[pNPP]). Data are representative of three independent experiments. The inhibitory mechanism for each compound was determined by fitting data to the equations defined for competitive, mixed, and uncompetitive inhibition models. Data represented in the graphs correspond to the best fit to each inhibition model (based on the R2 coefficient) (OriginPro 2018 (64-bit). SR1).](/cms/asset/625d86dd-b0df-4206-86b6-944aa1311c8f/ienz_a_2170369_f0005_c.jpg)
Table 3. Kinetic parameters of inhibition and type of inhibition of different compounds using hPTP1B1-400.
Figure 6. Structural model of PTP1B1-400 indicating the Active site and possible allosteric sites of inhibition. The catalytic domain is shown in pink cartoons and the unstructured region in a light blue cartoon, CGA in green sticks, SUR in red sticks, and UA in blue and yellow sticks.
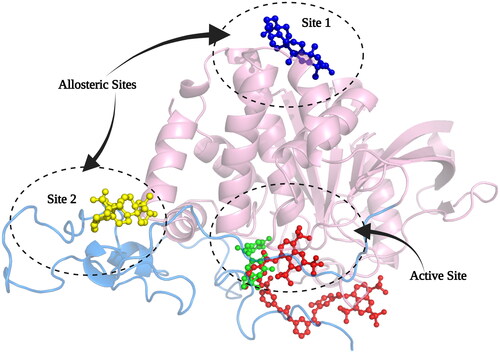
Figure 7. Analysis of the interacting amino acid residues in PTP1B-inhibitor complex. (A) UA-allosteric site 1, (B) UA-allosteric site 2, (C) CGA-catalytic site, and (D) SUR-catalytic site.PTP1B is shown in cartoons at the centre with compounds (1; orange stikers), (2; red stikers), (3; cyan stikers), (4; yellow stikers), and (5; green stikers). On the periphery are shown the analysis of the interactions with the residues at 4 Å.
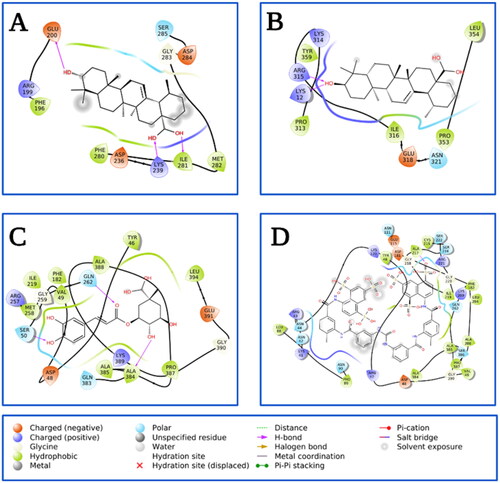
Table 4. Theoretical binding properties of hPTP1B1-400 inhibitor complex.