Figures & data
Figure 1. Some previously reported topoisomerase II inhibitors and DNA intercalators display their pharmacophoric characteristics.
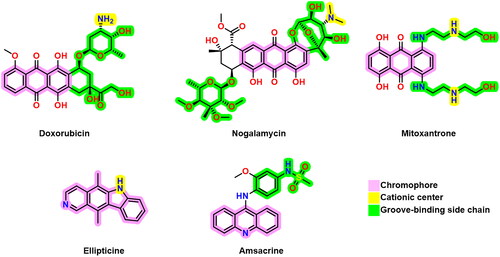
Figure 2. The 2D (A) and 3D (B) illustrations display the superimposition of the native co-crystallised EVP and redocked one (Mauve and Light Blue, respectively, in 3D picture) at the topoisomerase II-DNA complex (PDB entry: 3QX3) with RMSD value 1.42 Å.
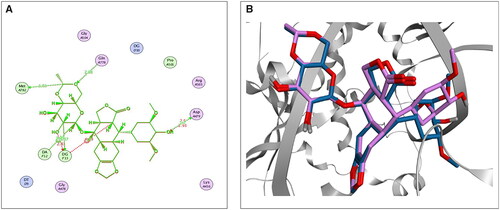
Table 1. The binding free energy scores, RMSD values, and binding interactions of the most promising compounds (SP, RO, AZ, CL, and ER) along with the co-crystallised ligand (EVP) into DNA–topoisomerase II complex.
Figure 3. 2D (A) and 3D (B) illustrations revealing the binding interactions of the re-docked co-crystallised ligand (EVP) at the topoisomerase II-DNA complex active site, where red dashed lines stand for H-bonds, and black ones stand for H-pi bonds.
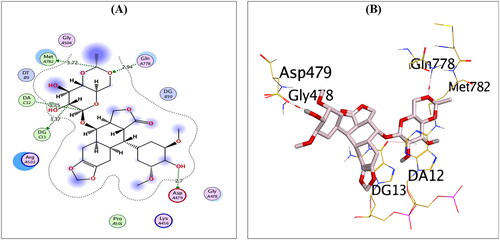
Figure 4. The 2D and 3D binding interactions of compounds AZ (A,B), CL (C,D), and ER (E,F) reveal their binding interactions at the topoisomerase II-DNA complex active site.
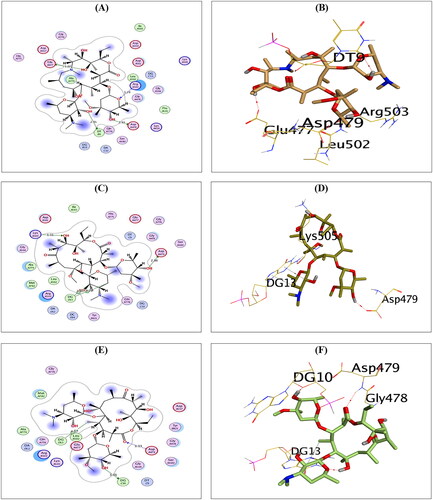
Figure 5. The 2D and 3D binding interactions of compounds RO (A,B), and SP (C,D) reveal their binding interactions at the topoisomerase II-DNA complex active site (PDB: 3QX3).
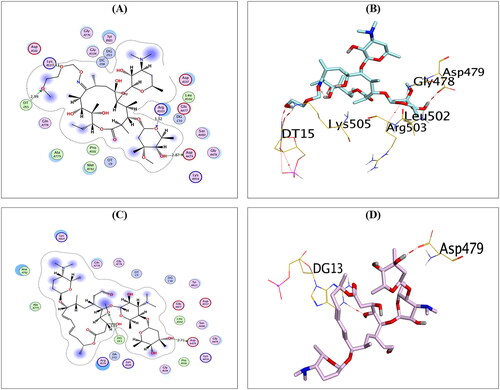
Figure 6. The RMSD of the six complexes (SP, RO, AZ, CL, and ER) within the topoisomerase II-DNA complex compared to the co-crystallised (EVP) inhibitor as a function of simulation time (200 ns).
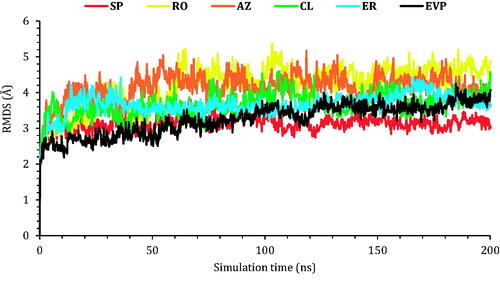
Figure 7. The RMSD of the ligands (SP, RO, AZ, CL, and ER) within the topoisomerase II-DNA complex compared to the co-crystallised (EVP) inhibitor as a function of simulation time (200 ns).
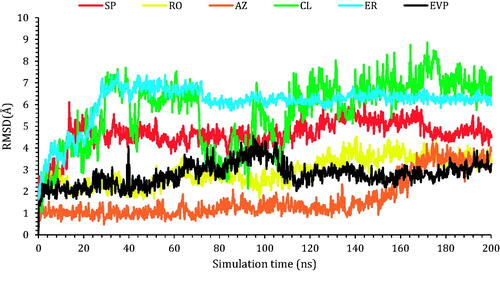
Figure 8. Histograms indicating the fractions of binding between the protein’s amino acids and its ligand for (A) SP-3QX3, (B) RO-3QX3, (C) AZ-3QX3, (D) CL-3QX3, (E) ER-3QX3, and (F) EVP-3QX3 complexes.
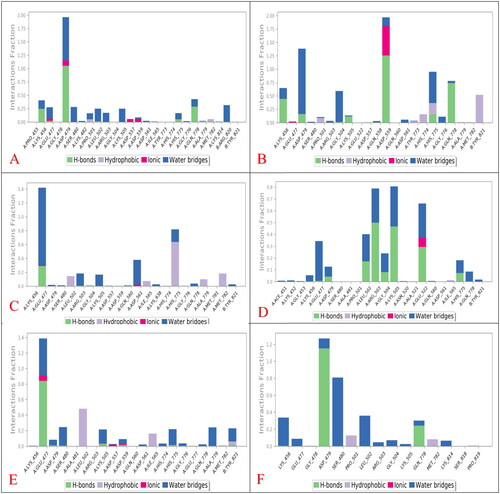
Table 2. Prime MM-GBSA energies for compounds SP, RO, AZ, CL, ER, and EVP at the binding pocket of the topoisomerase II-DNA complex.
Figure 10. Inhibitory potential (IC50) of the most promising and commercially available antibiotics (SP, RO, AZ, CL, and ER) against MCF-7, HepG2, and HCT-116.
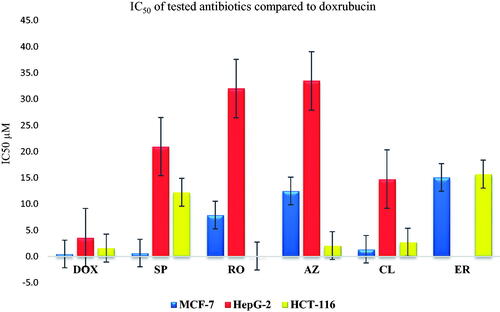
Figure 11. (A) The measured IC50 of tested antibiotics (SP, RO, AZ, CL, and ER) on TOP-2 compared to DOX. (B) Gel electrophoresis image representing the variable decatenation potential of DNA by TOP-2 as inhibited by DOX and the tested antibiotics (SP, RO, AZ, CL, and ER). The N Lane represents no TOP-2 activity while the P lane is the uninhibited enzyme.
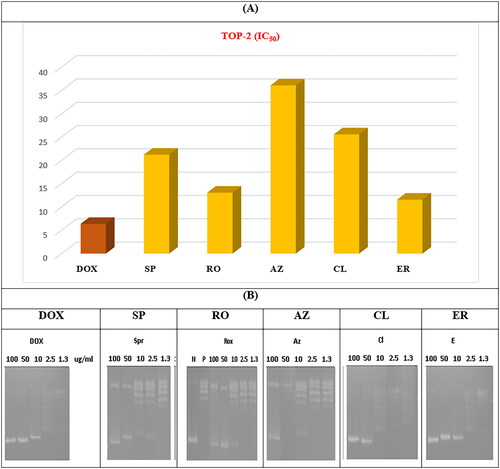
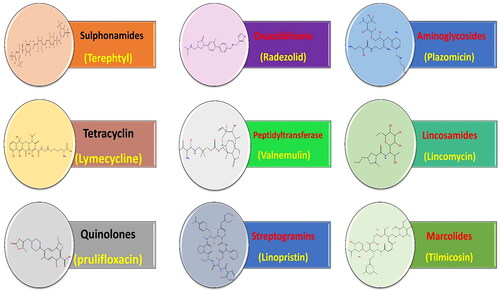
Figure 12. SAR study for the affinity of the examined 138 antibiotics as topoisomerase II inhibitors and DNA intercalators.