Figures & data
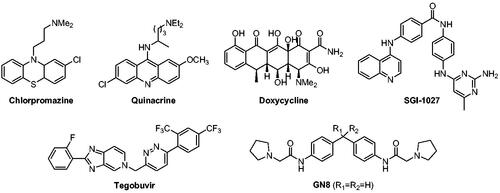
Figure 1. Representative compounds with anti-prion aggregation activity.
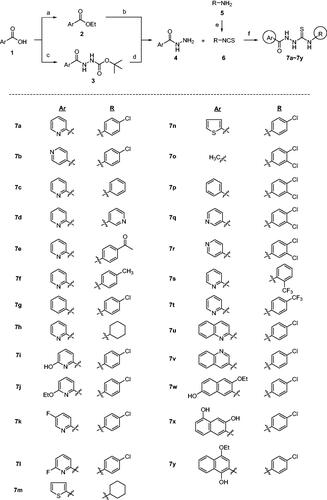
Scheme 1. Synthesis of 7a–7y with various Ar and R groups. Reagents and conditions: (A) H2SO4, EtOH, reflux, (B) H2NNH2H2O, EtOH, 80 °C, (C) H2N-NHt-Boc, HOAt, EDCl, NaHCO3, DMF, (D) 4 N HCl, dioxane, (E) CSCl2, Et3N, THF, 0 °C, (F) EtOH, r.t.
Scheme 2. Synthesis of analogues with modifications in thiosemicarbazide moiety of 7a. Reagents and conditions: (A) NH2NHBoc, Et2O, r.t., 1 day, 70%, (B) H2, Pd/C, MeOH, (C) (i) 4 N HCl-dioxane, 0 °C, 4 h, (ii) 11, Et3N, EtOH, r.t., 4 h, 20%, (D) NH2NHCH3⋅H2SO4, Et3N, EtOH, reflux, 5 days, 46%, (E) 11, EtOH, r.t., 4 h, 36% (for compound 14), 77% (for compound 16), (F) H2SO4 or HCl, EtOH, 0 °C → r.t., 2 h, 41%.
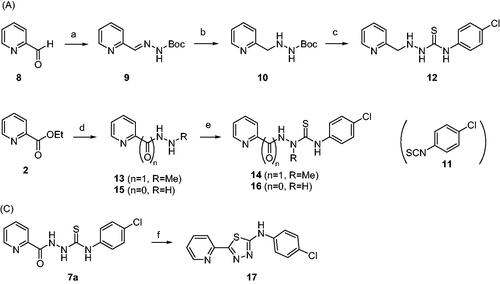
Figure 2. Area under the curve (AUC) of fluorescence curves obtained from PAFA. (A) vehicle condition. (B–E) Representative fluorescence curves by 7f, 7g, 7x, 7y, and 14, respectively. (F) Anti-prion activity of the compounds measured by PAFA. AUC is expressed as mean ± SEM of independent experiments (n = 9). Veh = vehicle condition where DMSO was treated instead of 100 µM compounds.
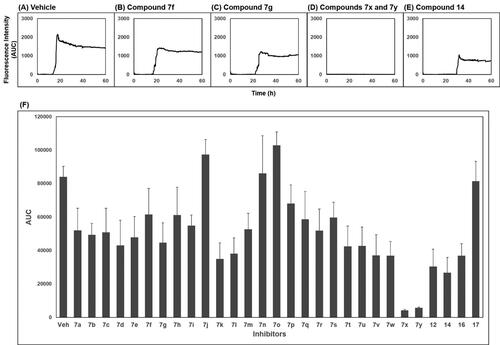
Figure 3. Potential cyclic structures through an internal hydrogen bond in 7x and 7y.
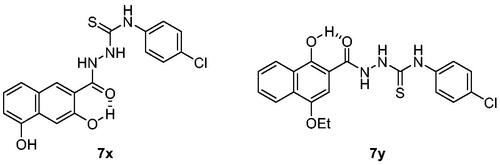
Figure 4. Activity of compounds to inhibit PAFA and dose–response curves. (A) PAFA with different concentrations of the compounds. The multiple PAFA reactions (n = 3) were performed and the mean of each data point was plotted. (B) Dose–response curves of the compounds based on mean AUC of each concentration from independent experiments (n = 3).
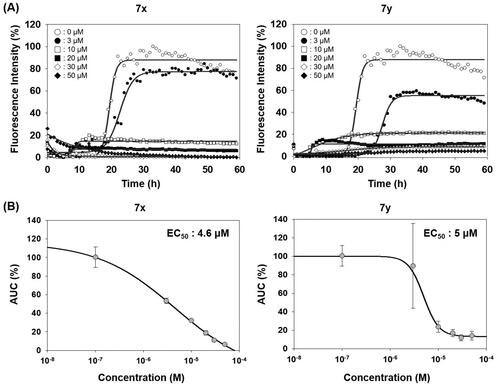
Figure 5. Biophysical states of PrP aggregates from PAFA. (A) PAFA with vehicle, positive control (SGI-1027), negative control (7b), and active compounds (7x and 7y) at 10 µM each. The multiple PAFA reactions (n = 3) were performed and the mean of each data point was plotted. (B) SDD-AGE analysis of the reaction products of PAFA shown in panel A. M, molecular weight size marker; PrP, recPrP monomer form; Veh, vehicle. (C) Micrographs of the reaction products of PAFA shown in panel A by AFM. Dotted rectangles were magnified and displayed below.
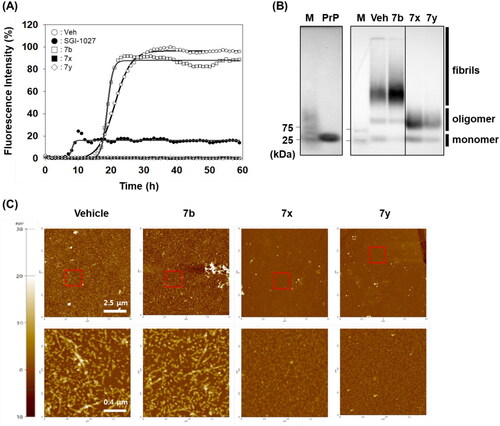
Figure 6. Activity of compounds to disassemble pre-existing aggregates. (A) Disaggregation curves of vehicle, negative control (7b), 7x, and 7y at 100 µM concentration. (B) Dose-dependent curves of 7x and 7y at different concentrations. Arrows indicate the time point of compound treatment. The multiple disaggregation reactions of PAFA products (n = 3) were conducted and the mean of each data point was plotted.
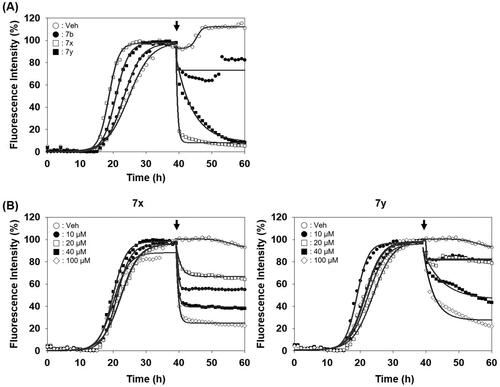
Figure 7. Activity of compounds to inhibit RT-QuIC and dose–response curves. (A) RT-QuIC assay at different concentrations of 7x and 7y. The assay was performed using mouse recPrP and 5x1 0 −6 diluted RML-ill mouse brain homogenates. Each concentration line represents mean of multiple RT-QuIC reactions (n = 3). (B) Dose–response curves of the compounds based on AUC of each concentration from independent experiments (n = 2).
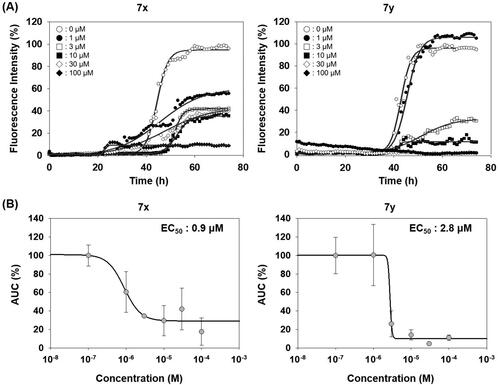
Figure 8. Activity of compounds to inhibit RT-QuIC performed with prions of various sources. Each RT-QuIC assay was performed using bank vole recPrP in the presence of 100 µM 7x and 7y. The prion seeds were 5 × 10⁻⁶ diluted brain homogenates of RML-ill mice, Hyper-ill Syrian hamsters and a CJD patient. Each concentration line represents mean of independent experiments (n = 3).
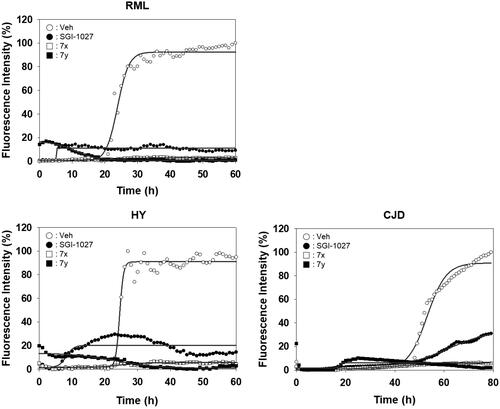
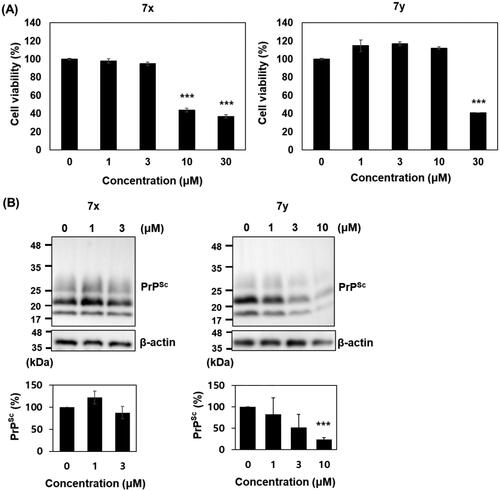
Figure 9. Cytotoxicity and anti-prion activity of compounds in ScN2a cells. (A) Cytotoxicity of 7x and 7y. The MTT assay were performed (n = 3) and the mean was plotted. (B) Western blots of PK-resistant PrPSc in the cells incubated with 7x and 7y. β-actin was used as a loading control. Western blotting was performed multiple times (n = 4). The PrPSc level of each blot was quantified by densitometry and the means were plotted. ***p < 0.01.