
Figures & data
Figure 1. Molecular structures: (A) the GTP/WT M-RAS complex, in which M-RAS, GTP and magnesium ion were depicted in cartoon, stick and ball modes, respectively, (B) binding pocket of GTP to M-RAS, in which binding pocket was shown in surface modes, (C) mutated sites of M-RAS displayed in dot modes (D) the structures of GTP shown in stick styles.
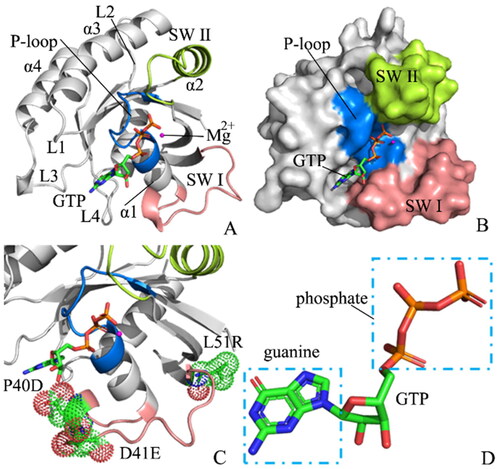
Figure 2. Structural flexibility and molecular surface areas of M-RAS in four systems: (A) RMSFs of the Cα atoms from M-RAS, (B) difference in RMSFs between the WT and mutated M-RAS, (C) structural domains with obvious alterations of RMSFs and (D) molecular surface area of the WT and mutated M-RAS.
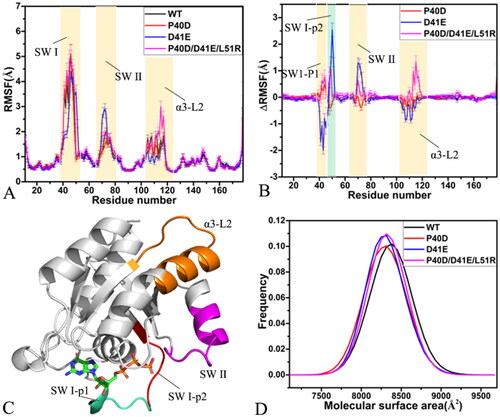
Figure 3. FEL and representative structures of the GTP/WT M-RAS complex: (A) FEL with four energy valleys EV1-EV4, (B) the structure located at the EV1, (C) the structure situated at the EV2, (D) the structure falling into the EV3, (E) the structure trapped in the EV4 and (F) structural superimposition of the GTP/WT M-RAS complexes located at the EV1-EV4. In this figure, M-RAS, GTP and ions Mg2+ and Na+ were displayed in cartoon, stick and ball patterns. The PMF was scaled in kcal/mol and the distance was indicated in Å.
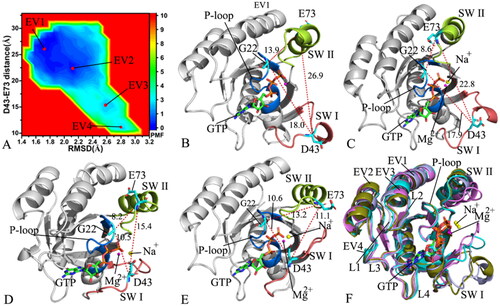
Figure 4. FEL and representative structures of the GTP/P40D M-RAS complex: (A) FEL with three energy valleys EV1-EV3, (B) the structure located at the EV1, (C) the structure situated at the EV2, (D) the structure falling into the EV3, (E) structural superimposition of GTP and magnesium ions trapped at the EV1-EV3 and (F) structural alignment of the GTP/P40D M-RAS complexes situated at the EV1-EV3. In this figure, M-RAS, GTP and ions Mg2+ and Na+ displayed in cartoon, stick and ball patterns. The PMF was measured in kcal/mol and the distance was represented in Å.
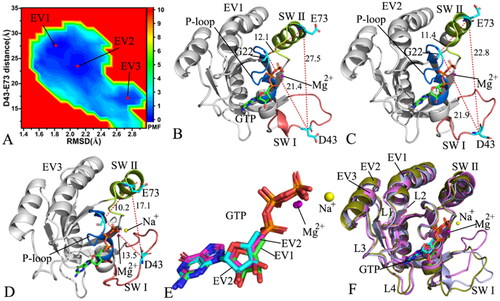
Figure 5. FEL and representative structures of the GTP/D41E M-RAS complex: (A) FEL with three energy valleys EV1-EV3, (B) the structure situated at the EV1, (C) the structure trapped at the EV2, (D) the structure corresponding to the EV3, (E) structural superimposition of GTP and magnesium ions falling into the EV1-EV3 and (F) structural alignment of the GTP/D41E M-RAS complexes situated at the EV1-EV3. In this figure, M-RAS, GTP and ions Mg2+ and Na+ depicted in cartoon, stick and ball patterns. The PMF was measured in kcal/mol and the distance was represented in Å.
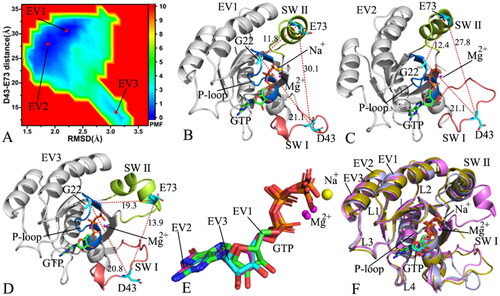
Figure 6. FEL and representative structures of the GTP-P40D/D41E/L51R M-RAS complex: (A) FEL with two energy valleys EV1 and EV2, (B) the structure located at the EV1, (C) the structure trapped at the EV2, (D) structural superimposition of GTP and magnesium ions situated at the EV1-EV2 and (E) interaction network of GTP with M-RAS in the incompact state of the switch domains and (F) interaction network of GTP with M-RAS in the compact state of the switch domains. In this figure, M-RAS, GTP and ions Mg2+ and Na+ depicted in cartoon, stick and ball patterns. The PMF was scaled in kcal/mol and the distance was indicated in Å.
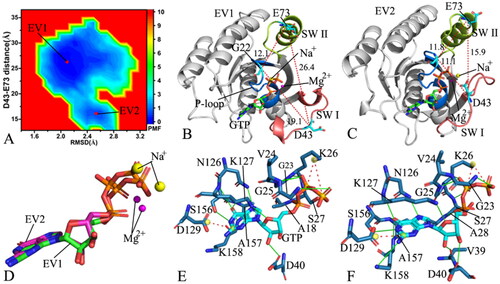
Figure 7. Collective motions of the structure domains from the GTP-bound WT and mutated M-RAS: (A) the GTP-bound WT M-RAS, (B) the GTP-bound P40D M-RAS, (C) the GTP-bound D41E M-RAS and (D) the GTP-bound P40D/D41E/L51R M-RAS.
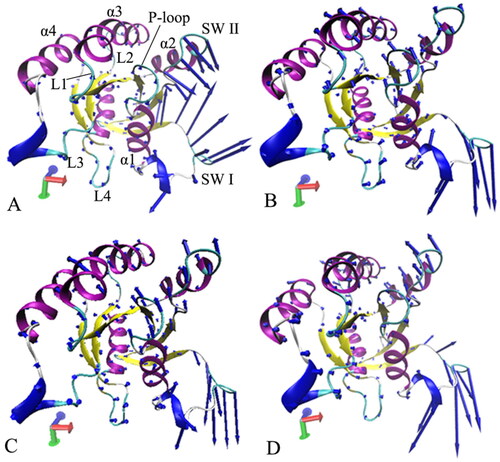
Figure 8. Interactions of magnesium ion with GTP, P-loop, SW I and SW II: (A) geometric information involved in interactions of magnesium ion, (B) the frequency distribution for the distance of Mg2+ away from the oxygen atom OG of S27, (C) the frequency distribution for the distance between Mg2+ and oxygen atom O of T45, (D) the frequency distribution for the distance of Mg2+ away from the mass centre of the oxygen atoms OD1 and OD2 of D67, (E) the frequency distribution for the frequency distribution forthe distance between Mg2+ and the oxygen atom O2B of GTP and (F) the frequency distribution for the distance of Mg2+ away from the oxygen atom O2G of GTP.
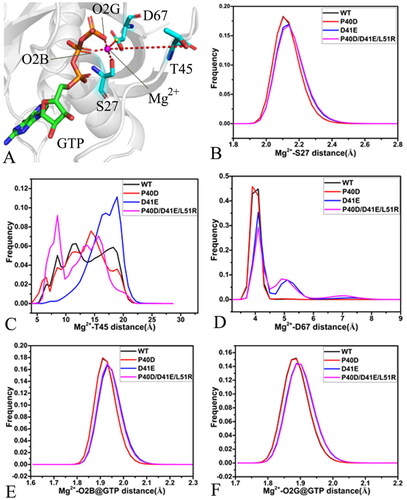
Figure 9. The salt bridge interactions and the π–π interaction of GTP with M-RAS: (A) the frequency distribution of the distance between NZ and PB for the salt bridge interaction of GTP with K26, (D) the frequency distribution of the distance between NZ and PG for the salt bridge interaction of GTP with K26, (C) the frequency distribution of the distance for the salt bridge between D129 and GTP and (D) the frequency distribution of the distance for the π-π interaction of F28 with GTP.
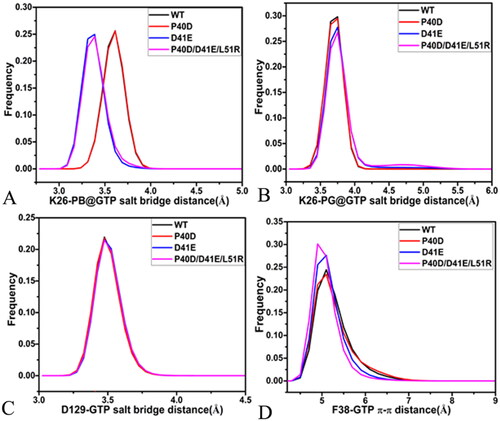
Figure 10. Geometric positions of GTP relative to key residues of M-RAS: (A) the salt bridge interactions of GTP with K26 and D129 as well as the π–π interaction of GTP with F38, (B) HBIs of GTP with residues in the P-loop, (C) HBIs of GTP with residues in the loops L3 and L4 and (D) HBIs of GTP with residues in the switch domains.
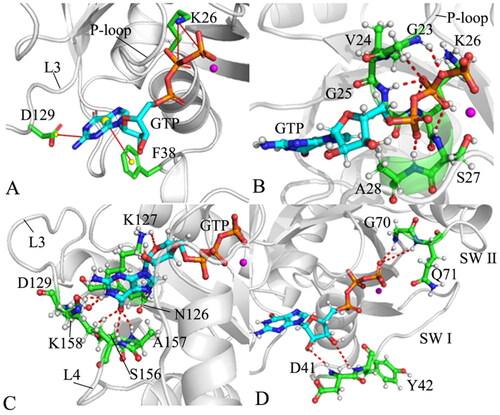
Table 1. Hydrogen bonding interactions of GTP with the WT and mutated M-RAS.