Figures & data

Figure 1. Compounds investigated in this work.
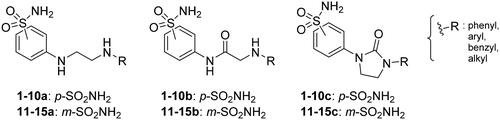
Figure 2. Overview of the tail approach and the design strategy used in the current work.
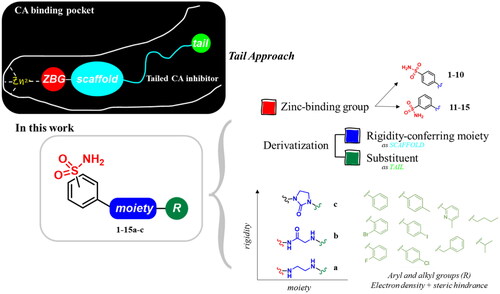
Table 1. Inhibition data of sulfonamides 1–15a–c and reference compound AAZ on hCAs I and II and VchCAs through the stopped-flow CO2 hydrase assay. 
Table 2. Flexibility properties of compounds 1a–c and 9a–c, selected as representative of the whole library of derivatives, calculated through FAFDrugs4 webtool.
Figure 3. (A, C, E, and G) Predicted 3D binding mode and (B, D, F, and H) corresponding ligand interaction diagram of most selective ligands (A, B) 9c yellow, (C, D) 12c magenta, (E, F) 4b orange, and (G, H) 10a cyan, within VchαCA (light grey). The compounds are represented as sticks, and the protein surface is visualised.
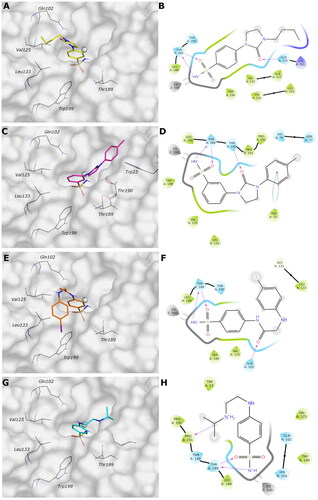
Figure 4. Most representative geometry retrieved after MD simulation for the four studied ligands. (A) 9c yellow, (B) 12c magenta, (C) 4b orange, and (D) 10a cyan in the VchαCA (light grey). The compounds are represented in stick and the protein surface is visualised.
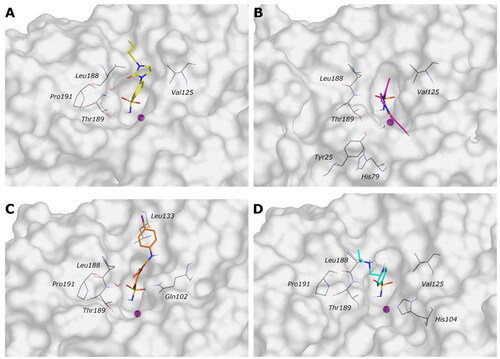
Figure 5. (A, C, E, and G) The 2D representation of most conserved ligand–protein interactions with (B, D, F, and H) the indication of the persistence (%) along the simulation and depiction of frequency and type of ligand-protein interaction along with the MD simulation. (A, B) 9c, (C, D) 12c, (E, F) 4b, and (G, H) 10a.
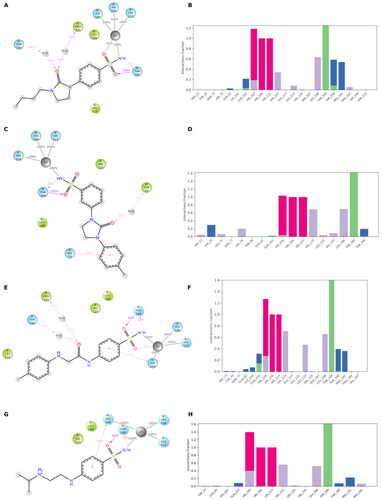
Figure 6. (A) Predicted 3D binding mode and (B) corresponding ligand interaction diagram of the most selective ligands 9c (yellow) in the hCA I (light salon). The compound is represented as the stick and the protein surface is visualised.
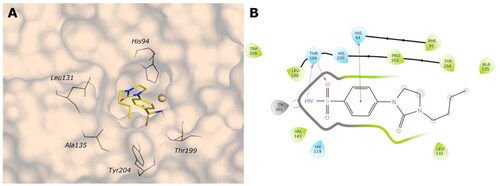
Figure 7. (A) Predicted 3D binding mode and (B) corresponding ligand interaction diagram of the most selective ligand 9c (yellow) in the hCA II (light cyan). The compounds are represented as a stick and the protein surface is visualised.
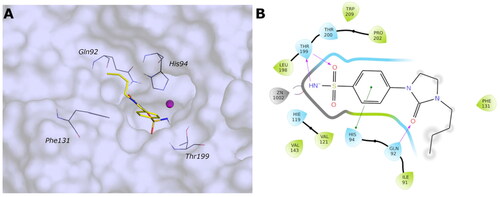
Figure 8. (A) Predicted 3D binding mode and (B) corresponding ligand interaction diagram of the most selective ligand 9c (yellow) within VchβCA (grey and pink). The compound is represented as a stick and the protein surface is visualised.
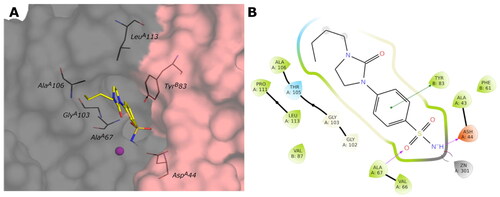
Figure 9. (A) Predicted 3D binding mode and (B) corresponding ligand interaction diagram of the most selective ligand 9c (yellow) within VchβCA (grey and pink). The compound is represented as a stick and the protein surface is visualised.
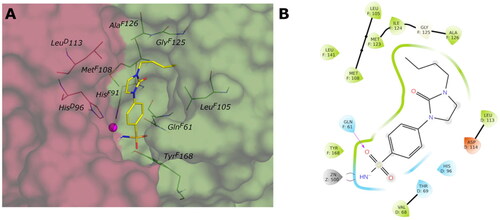
Figure 10. Schematic representation of the ligand contacts producing the selectivity towards VchαCA with respect to hCAs. The compound (9c) is represented as sticks and the VchαCA coil and the short alpha helix hCAII (similar to hCAI) are visualised as cartoon and surface.
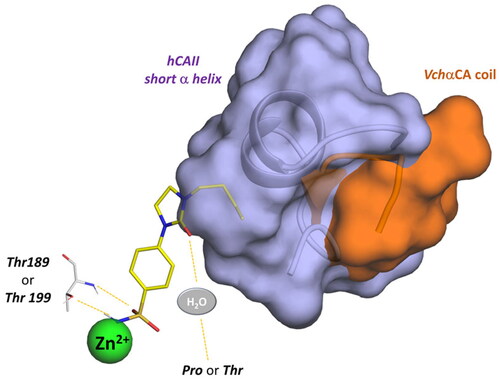
Table 3. Physicochemical and pharmacokinetic properties of the studied ligands.
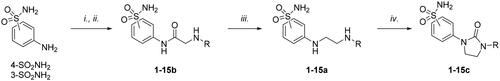
Scheme 1. Synthesis of compounds 1-15a–c. Reagents and conditions: (i) chloroacetyl chloride, dry acetone, N2, 0 °C, 0.5 h; (ii) appropriately substituted aniline, KI, sealed tube, dry THF, N2, 110 °C, 24 h; or 2-amino-6-methylpyridine, dry TEA, abs EtOH, N2, ref., 24 h; or benzylamine, dry TEA, dry ACN, N2, 24 h; or amine, KI, dry THF, N2, 24 h; (iii) 1 M BH3·THF, dry THF, N2, r.t., 24 h; or LiAlH4, dry THF, N2, 0–70 °C, 24 h; (iv). triphosgene, dry TEA, dry THF, N2, r.t., 2 h.